
Consider GLOBUS MEDICAL INC - A (NYSE:GMED) as an affordable growth stock, identified by our stock screening tool. NYSE:GMED is showcasing impressive growth figures and is well-positioned in terms of profitability, solvency, and liquidity. Moreover, it seems to be priced reasonably. Let's dive deeper into the analysis.
Understanding NYSE:GMED's Growth Score
To evaluate a stock's growth potential, ChartMill utilizes a Growth Rating on a scale of 0 to 10. This comprehensive assessment considers various growth aspects, including historical and estimated EPS and revenue growth. NYSE:GMED has achieved a 7 out of 10:
- GMED shows a strong growth in Earnings Per Share. In the last year, the EPS has been growing by 17.33%, which is quite good.
- GMED shows a strong growth in Revenue. In the last year, the Revenue has grown by 103.89%.
- Measured over the past years, GMED shows a quite strong growth in Revenue. The Revenue has been growing by 17.08% on average per year.
- GMED is expected to show quite a strong growth in Earnings Per Share. In the coming years, the EPS will grow by 17.70% yearly.
- The Revenue is expected to grow by 17.25% on average over the next years. This is quite good.
- When comparing the EPS growth rate of the last years to the growth rate of the upcoming years, we see that the growth is accelerating.
Valuation Analysis for NYSE:GMED
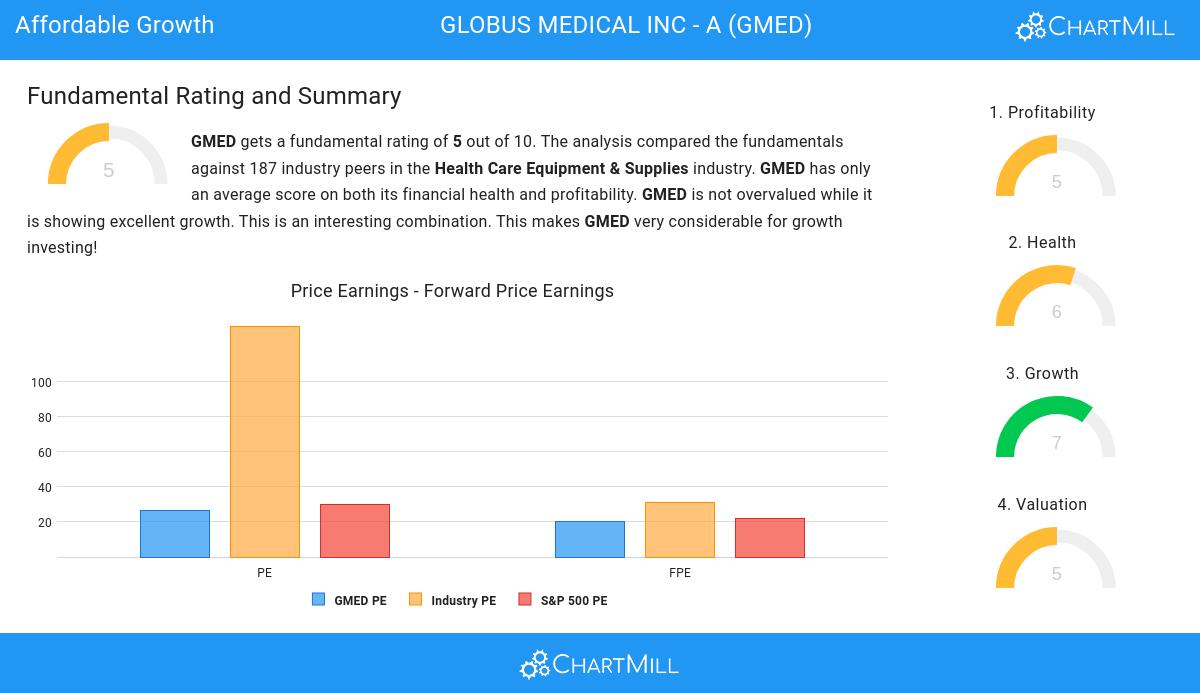
ChartMill employs its own Valuation Rating system for all stocks. This score, ranging from 0 to 10, is determined by evaluating different valuation factors, including price to earnings and free cash flow, both in absolute terms and relative to the market and industry. NYSE:GMED has earned a 5 for valuation:
- Compared to the rest of the industry, the Price/Earnings ratio of GMED indicates a rather cheap valuation: GMED is cheaper than 81.28% of the companies listed in the same industry.
- GMED's Price/Forward Earnings ratio is rather cheap when compared to the industry. GMED is cheaper than 82.89% of the companies in the same industry.
- Based on the Enterprise Value to EBITDA ratio, GMED is valued a bit cheaper than the industry average as 76.47% of the companies are valued more expensively.
- Based on the Price/Free Cash Flow ratio, GMED is valued a bit cheaper than the industry average as 75.94% of the companies are valued more expensively.
- GMED's earnings are expected to grow with 19.20% in the coming years. This may justify a more expensive valuation.
ChartMill's Evaluation of Health
ChartMill assigns a proprietary Health Rating to each stock. The score is computed by evaluating various liquidity and solvency ratios and ranges from 0 to 10. NYSE:GMED was assigned a score of 6 for health:
- GMED has an Altman-Z score of 6.67. This indicates that GMED is financially healthy and has little risk of bankruptcy at the moment.
- With an excellent Altman-Z score value of 6.67, GMED belongs to the best of the industry, outperforming 83.96% of the companies in the same industry.
- The Debt to FCF ratio of GMED is 2.68, which is a good value as it means it would take GMED, 2.68 years of fcf income to pay off all of its debts.
- GMED's Debt to FCF ratio of 2.68 is amongst the best of the industry. GMED outperforms 86.63% of its industry peers.
- A Debt/Equity ratio of 0.00 indicates that GMED is not too dependend on debt financing.
- GMED has a Debt to Equity ratio of 0.00. This is in the better half of the industry: GMED outperforms 68.98% of its industry peers.
- A Current Ratio of 2.42 indicates that GMED has no problem at all paying its short term obligations.
What does the Profitability looks like for NYSE:GMED
ChartMill utilizes a Profitability Rating to assess stocks, scoring them on a scale of 0 to 10. This rating takes into account a variety of profitability ratios and margins, both in absolute terms and in comparison to industry peers. NYSE:GMED has earned a 5 out of 10:
- With a decent Return On Assets value of 0.81%, GMED is doing good in the industry, outperforming 73.26% of the companies in the same industry.
- With a decent Return On Equity value of 1.02%, GMED is doing good in the industry, outperforming 73.26% of the companies in the same industry.
- GMED's Return On Invested Capital of 3.06% is fine compared to the rest of the industry. GMED outperforms 72.73% of its industry peers.
- With a decent Profit Margin value of 1.82%, GMED is doing good in the industry, outperforming 74.33% of the companies in the same industry.
- GMED has a Operating Margin of 7.53%. This is in the better half of the industry: GMED outperforms 74.33% of its industry peers.
Our Affordable Growth screener lists more Affordable Growth stocks and is updated daily.
For an up to date full fundamental analysis you can check the fundamental report of GMED
Keep in mind
This is not investing advice! The article highlights some of the observations at the time of writing, but you should always make your own analysis and invest based on your own insights.