NASDAQ:GMAB qualifies as a high growth stock and is consolidating.
By Mill Chart
Last update: Oct 9, 2024
Exploring Growth Potential: GENMAB A/S -SP ADR (NASDAQ:GMAB) and Its Base Formation. Growth investors seek promising revenue and EPS growth, and GENMAB A/S -SP ADR has come under our scrutiny for potential growth investing. While it's crucial to do your own research, we've detected GENMAB A/S -SP ADR on our screen for growth with base formation, suggesting it merits a closer look.
Evaluating Growth: NASDAQ:GMAB
Every stock receives a Growth Rating from ChartMill, ranging from 0 to 10. This rating assesses various growth aspects, including historical and projected EPS and revenue growth. NASDAQ:GMAB boasts a 8 out of 10:
- GMAB shows a strong growth in Earnings Per Share. In the last year, the EPS has been growing by 16.52%, which is quite good.
- The Earnings Per Share has been growing by 22.70% on average over the past years. This is a very strong growth
- The Revenue has grown by 15.89% in the past year. This is quite good.
- GMAB shows a strong growth in Revenue. Measured over the last years, the Revenue has been growing by 40.35% yearly.
- GMAB is expected to show a strong growth in Earnings Per Share. In the coming years, the EPS will grow by 23.65% yearly.
- The Revenue is expected to grow by 17.51% on average over the next years. This is quite good.
How We Gauge Health for NASDAQ:GMAB
ChartMill utilizes a Health Rating to assess stocks, scoring them on a scale of 0 to 10. This rating takes into account a variety of liquidity and solvency ratios, both in absolute terms and in comparison to industry peers. NASDAQ:GMAB has earned a 7 out of 10:
- GMAB has an Altman-Z score of 10.19. This indicates that GMAB is financially healthy and has little risk of bankruptcy at the moment.
- With an excellent Altman-Z score value of 10.19, GMAB belongs to the best of the industry, outperforming 86.62% of the companies in the same industry.
- The Debt to FCF ratio of GMAB is 0.16, which is an excellent value as it means it would take GMAB, only 0.16 years of fcf income to pay off all of its debts.
- GMAB has a better Debt to FCF ratio (0.16) than 97.71% of its industry peers.
- A Debt/Equity ratio of 0.03 indicates that GMAB is not too dependend on debt financing.
- GMAB has a Current Ratio of 5.03. This indicates that GMAB is financially healthy and has no problem in meeting its short term obligations.
- A Quick Ratio of 5.02 indicates that GMAB has no problem at all paying its short term obligations.
Evaluating Profitability: NASDAQ:GMAB
ChartMill's Profitability Rating offers a unique perspective on stock analysis, providing scores from 0 to 10. These ratings consider a wide range of profitability metrics and margins, both in comparison to industry peers and on their own merits. For NASDAQ:GMAB, the assigned 8 is a significant indicator of profitability:
- With an excellent Return On Assets value of 14.25%, GMAB belongs to the best of the industry, outperforming 98.24% of the companies in the same industry.
- With an excellent Return On Equity value of 17.77%, GMAB belongs to the best of the industry, outperforming 96.83% of the companies in the same industry.
- GMAB's Return On Invested Capital of 13.65% is amongst the best of the industry. GMAB outperforms 96.65% of its industry peers.
- The 3 year average ROIC (13.32%) for GMAB is below the current ROIC(13.65%), indicating increased profibility in the last year.
- GMAB's Profit Margin of 29.01% is amongst the best of the industry. GMAB outperforms 98.24% of its industry peers.
- GMAB has a Operating Margin of 31.65%. This is amongst the best in the industry. GMAB outperforms 98.77% of its industry peers.
- The Gross Margin of GMAB (96.83%) is better than 97.01% of its industry peers.
How do we evaluate the setup for NASDAQ:GMAB?
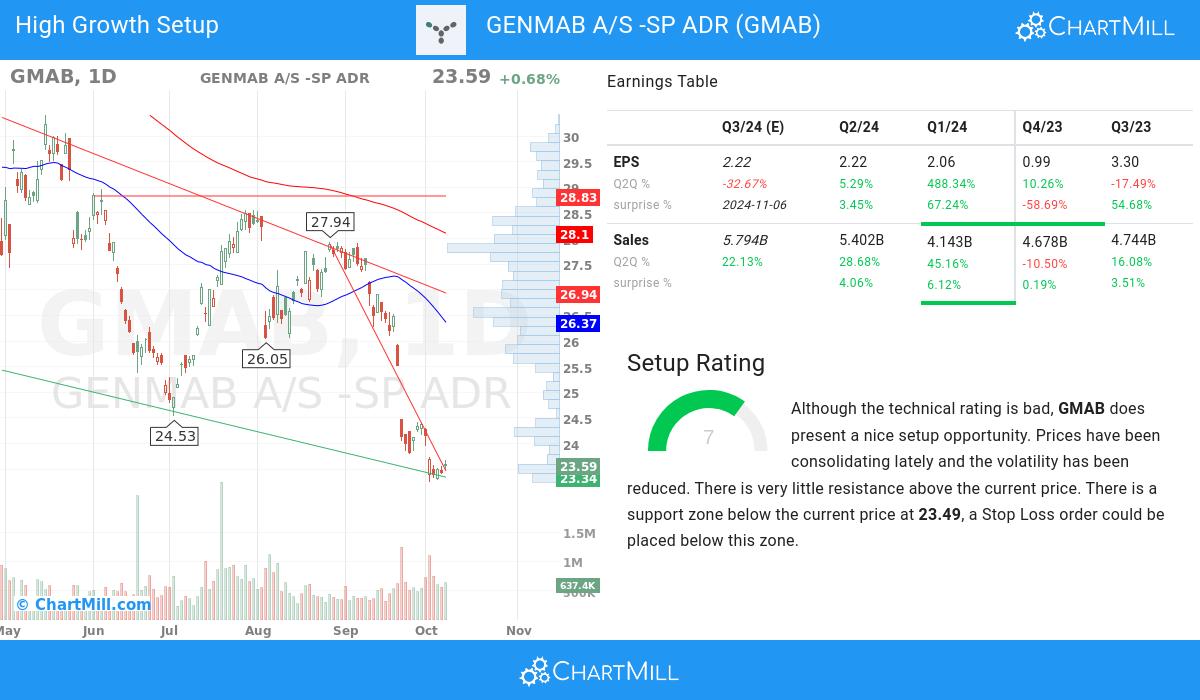
Next to the Technical Rating, the Setup Rating of a stock determines to which extend the stock is consolidating. This score also ranges from 0 to 10 and is updated daily. The setup score evaluates various short term technical indicators. For NASDAQ:GMAB this score is currently 7:
Although the technical rating is bad, GMAB does present a nice setup opportunity. We see reduced volatility while prices have been consolidating in the most recent period. There is very little resistance above the current price. There is a support zone below the current price at 23.49, a Stop Loss order could be placed below this zone.
Our Strong Growth screener lists more Strong Growth stocks and is updated daily.
Check the latest full fundamental report of GMAB for a complete fundamental analysis.
For an up to date full technical analysis you can check the technical report of GMAB
Disclaimer
This is not investing advice! The article highlights some of the observations at the time of writing, but you should always make your own analysis and invest based on your own insights.
20.63
+0.04 (+0.19%)
Find more stocks in the Stock Screener
GMAB Latest News and Analysis
 10 minutes ago - ChartmillGENMAB A/S -SP ADR (NASDAQ:GMAB): a strong growth stock preparing for the next leg up?.
Based on a technical and fundamental analysis of NASDAQ:GMAB we can say: GENMAB A/S -SP ADR (NASDAQ:GMAB), a strong growth stock, setting up for a breakout.
 6 days ago - ChartmillWhy Peter Lynch may take an interest in GENMAB A/S -SP ADR (NASDAQ:GMAB)
Peter Lynch, one of the most successful investors of all time, focused on growth stocks with strong fundamentals and a business model that’s easy to understand. Let’s analyze whether GENMAB A/S -SP ADR (NASDAQ:GMAB) fits his legendary investment approach.
 10 days ago - ChartmillDespite its growth, GENMAB A/S -SP ADR (NASDAQ:GMAB) remains within the realm of affordability.
GENMAB A/S -SP ADR was identified as a growth stock that isn't overvalued. NASDAQ:GMAB is excelling in various growth indicators while maintaining a solid financial footing.
