
Our stock screener has spotted GENMAB A/S -SP ADR (NASDAQ:GMAB) as a growth stock which is not overvalued. NASDAQ:GMAB is scoring great on several growth aspects while it also shows decent health and profitability. At the same time it remains remains attractively priced. We'll dive into each aspect below.
Assessing Growth Metrics for NASDAQ:GMAB
ChartMill assigns a Growth Rating to each stock, ranging from 0 to 10. This rating is determined by analyzing different growth elements, including EPS and revenue growth, spanning both historical and future figures. In the case of NASDAQ:GMAB, the assigned 8 reflects its growth potential:
- The Earnings Per Share has grown by an nice 16.52% over the past year.
- The Earnings Per Share has been growing by 22.70% on average over the past years. This is a very strong growth
- GMAB shows quite a strong growth in Revenue. In the last year, the Revenue has grown by 15.89%.
- The Revenue has been growing by 40.35% on average over the past years. This is a very strong growth!
- Based on estimates for the next years, GMAB will show a very strong growth in Earnings Per Share. The EPS will grow by 23.65% on average per year.
- The Revenue is expected to grow by 17.51% on average over the next years. This is quite good.
Valuation Examination for NASDAQ:GMAB
ChartMill assigns a proprietary Valuation Rating to each stock. The score is computed by evaluating various valuation aspects, like price to earnings and free cash flow, both absolutely as relative to the market and industry. NASDAQ:GMAB was assigned a score of 8 for valuation:
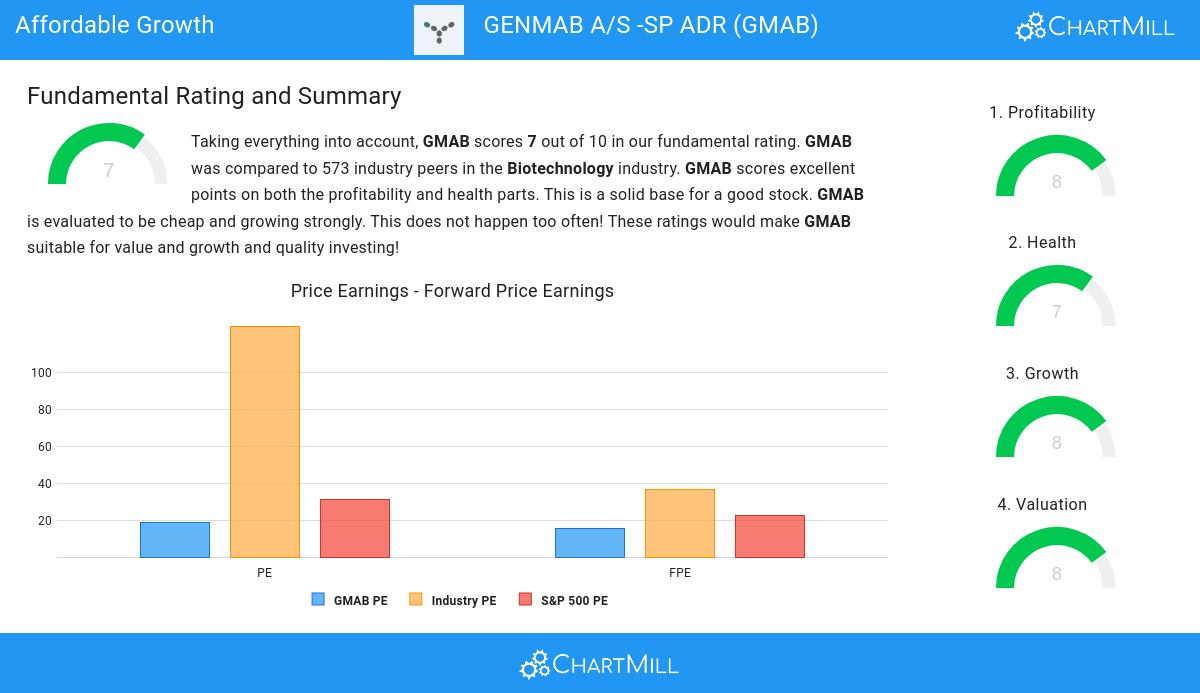
- Based on the Price/Earnings ratio, GMAB is valued cheaper than 96.48% of the companies in the same industry.
- Compared to an average S&P500 Price/Earnings ratio of 31.01, GMAB is valued a bit cheaper.
- Based on the Price/Forward Earnings ratio, GMAB is valued cheaper than 96.48% of the companies in the same industry.
- When comparing the Price/Forward Earnings ratio of GMAB to the average of the S&P500 Index (22.36), we can say GMAB is valued slightly cheaper.
- Based on the Enterprise Value to EBITDA ratio, GMAB is valued cheaper than 97.01% of the companies in the same industry.
- GMAB's Price/Free Cash Flow ratio is rather cheap when compared to the industry. GMAB is cheaper than 97.89% of the companies in the same industry.
- The low PEG Ratio(NY), which compensates the Price/Earnings for growth, indicates a rather cheap valuation of the company.
- The excellent profitability rating of GMAB may justify a higher PE ratio.
- GMAB's earnings are expected to grow with 24.30% in the coming years. This may justify a more expensive valuation.
Evaluating Health: NASDAQ:GMAB
To gauge a stock's financial health, ChartMill utilizes a Health Rating on a scale of 0 to 10. This comprehensive evaluation encompasses liquidity and solvency, both in absolute terms and in comparison to industry peers. NASDAQ:GMAB has earned a 7 out of 10:
- An Altman-Z score of 10.12 indicates that GMAB is not in any danger for bankruptcy at the moment.
- GMAB has a Altman-Z score of 10.12. This is amongst the best in the industry. GMAB outperforms 86.80% of its industry peers.
- The Debt to FCF ratio of GMAB is 0.16, which is an excellent value as it means it would take GMAB, only 0.16 years of fcf income to pay off all of its debts.
- With an excellent Debt to FCF ratio value of 0.16, GMAB belongs to the best of the industry, outperforming 97.71% of the companies in the same industry.
- GMAB has a Debt/Equity ratio of 0.03. This is a healthy value indicating a solid balance between debt and equity.
- GMAB has a Current Ratio of 5.03. This indicates that GMAB is financially healthy and has no problem in meeting its short term obligations.
- GMAB has a Quick Ratio of 5.02. This indicates that GMAB is financially healthy and has no problem in meeting its short term obligations.
Profitability Analysis for NASDAQ:GMAB
ChartMill employs its own Profitability Rating system for stock evaluation. This score, ranging from 0 to 10, is derived from an analysis of diverse profitability metrics and margins. In the case of NASDAQ:GMAB, the assigned 8 is noteworthy for profitability:
- GMAB has a Return On Assets of 14.25%. This is amongst the best in the industry. GMAB outperforms 98.24% of its industry peers.
- GMAB has a Return On Equity of 17.77%. This is amongst the best in the industry. GMAB outperforms 96.83% of its industry peers.
- Looking at the Return On Invested Capital, with a value of 13.65%, GMAB belongs to the top of the industry, outperforming 96.65% of the companies in the same industry.
- The last Return On Invested Capital (13.65%) for GMAB is above the 3 year average (13.32%), which is a sign of increasing profitability.
- GMAB's Profit Margin of 29.01% is amongst the best of the industry. GMAB outperforms 98.24% of its industry peers.
- With an excellent Operating Margin value of 31.65%, GMAB belongs to the best of the industry, outperforming 98.77% of the companies in the same industry.
- The Gross Margin of GMAB (96.83%) is better than 97.01% of its industry peers.
More Affordable Growth stocks can be found in our Affordable Growth screener.
For an up to date full fundamental analysis you can check the fundamental report of GMAB
Disclaimer
This is not investing advice! The article highlights some of the observations at the time of writing, but you should always make your own analysis and invest based on your own insights.