
Discover GENMAB A/S -SP ADR (NASDAQ:GMAB)—an undervalued stock our stock screener has picked out. NASDAQ:GMAB demonstrates solid fundamentals, including health and profitability, all while staying attractively priced. Let's explore the details.
A Closer Look at Valuation for NASDAQ:GMAB
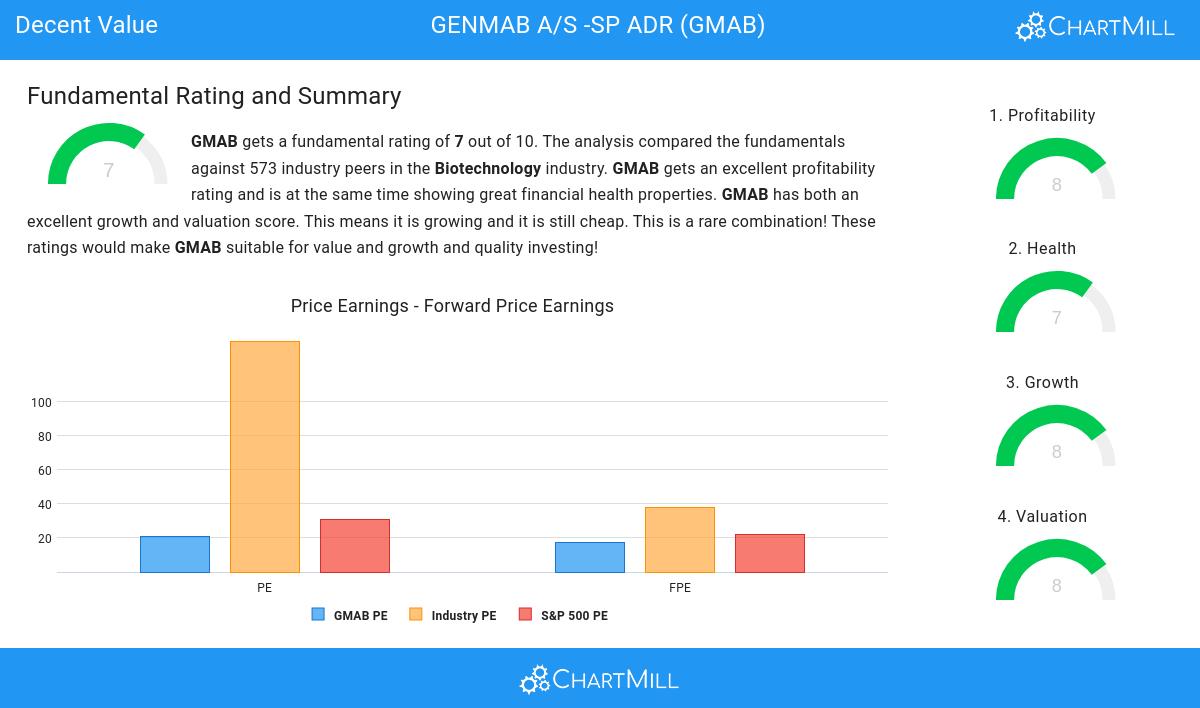
ChartMill assigns a proprietary Valuation Rating to each stock. The score is computed by evaluating various valuation aspects, like price to earnings and free cash flow, both absolutely as relative to the market and industry. NASDAQ:GMAB was assigned a score of 8 for valuation:
- GMAB's Price/Earnings ratio is rather cheap when compared to the industry. GMAB is cheaper than 96.48% of the companies in the same industry.
- GMAB is valuated rather cheaply when we compare the Price/Earnings ratio to 30.71, which is the current average of the S&P500 Index.
- GMAB's Price/Forward Earnings ratio is rather cheap when compared to the industry. GMAB is cheaper than 95.42% of the companies in the same industry.
- The average S&P500 Price/Forward Earnings ratio is at 22.09. GMAB is valued slightly cheaper when compared to this.
- Compared to the rest of the industry, the Enterprise Value to EBITDA ratio of GMAB indicates a rather cheap valuation: GMAB is cheaper than 96.65% of the companies listed in the same industry.
- Compared to the rest of the industry, the Price/Free Cash Flow ratio of GMAB indicates a rather cheap valuation: GMAB is cheaper than 97.89% of the companies listed in the same industry.
- The low PEG Ratio(NY), which compensates the Price/Earnings for growth, indicates a rather cheap valuation of the company.
- The excellent profitability rating of GMAB may justify a higher PE ratio.
- A more expensive valuation may be justified as GMAB's earnings are expected to grow with 24.30% in the coming years.
How do we evaluate the Profitability for NASDAQ:GMAB?
Discover ChartMill's exclusive Profitability Rating, a proprietary metric that assesses stocks on a scale of 0 to 10. It takes into consideration various profitability ratios and margins, both in absolute terms and relative to industry peers. Notably, NASDAQ:GMAB has achieved a 8:
- GMAB has a better Return On Assets (14.25%) than 98.24% of its industry peers.
- GMAB has a Return On Equity of 17.77%. This is amongst the best in the industry. GMAB outperforms 97.01% of its industry peers.
- With an excellent Return On Invested Capital value of 13.65%, GMAB belongs to the best of the industry, outperforming 96.65% of the companies in the same industry.
- The 3 year average ROIC (13.32%) for GMAB is below the current ROIC(13.65%), indicating increased profibility in the last year.
- GMAB has a better Profit Margin (29.01%) than 98.06% of its industry peers.
- Looking at the Operating Margin, with a value of 31.65%, GMAB belongs to the top of the industry, outperforming 98.77% of the companies in the same industry.
- GMAB has a better Gross Margin (96.83%) than 97.36% of its industry peers.
Health Assessment of NASDAQ:GMAB
A critical element of ChartMill's stock evaluation is the Health Rating, which spans from 0 to 10. This rating considers multiple health factors, including liquidity and solvency, both in absolute terms and relative to industry peers. NASDAQ:GMAB has received a 7 out of 10:
- An Altman-Z score of 11.08 indicates that GMAB is not in any danger for bankruptcy at the moment.
- With an excellent Altman-Z score value of 11.08, GMAB belongs to the best of the industry, outperforming 86.62% of the companies in the same industry.
- GMAB has a debt to FCF ratio of 0.16. This is a very positive value and a sign of high solvency as it would only need 0.16 years to pay back of all of its debts.
- GMAB has a better Debt to FCF ratio (0.16) than 97.89% of its industry peers.
- GMAB has a Debt/Equity ratio of 0.03. This is a healthy value indicating a solid balance between debt and equity.
- GMAB has a Current Ratio of 5.03. This indicates that GMAB is financially healthy and has no problem in meeting its short term obligations.
- A Quick Ratio of 5.02 indicates that GMAB has no problem at all paying its short term obligations.
Assessing Growth for NASDAQ:GMAB
ChartMill assigns a Growth Rating to every stock. This score ranges from 0 to 10 and evaluates the different growth aspects like EPS and Revenue, both in the past as in the future. NASDAQ:GMAB scores a 8 out of 10:
- GMAB shows a strong growth in Earnings Per Share. In the last year, the EPS has been growing by 16.52%, which is quite good.
- GMAB shows a strong growth in Earnings Per Share. Measured over the last years, the EPS has been growing by 22.70% yearly.
- Looking at the last year, GMAB shows a quite strong growth in Revenue. The Revenue has grown by 15.89% in the last year.
- The Revenue has been growing by 40.35% on average over the past years. This is a very strong growth!
- Based on estimates for the next years, GMAB will show a very strong growth in Earnings Per Share. The EPS will grow by 23.65% on average per year.
- GMAB is expected to show quite a strong growth in Revenue. In the coming years, the Revenue will grow by 17.51% yearly.
More Decent Value stocks can be found in our Decent Value screener.
Check the latest full fundamental report of GMAB for a complete fundamental analysis.
Disclaimer
Important Note: The content of this article is not intended as trading advice. It is essential to perform your own analysis and exercise caution when making trading decisions. The article presents observations created by automated analysis but does not guarantee any trading or investment outcomes. Always trade responsibly and make independent judgments.