
Consider GENMAB A/S -SP ADR (NASDAQ:GMAB) as an affordable growth stock, identified by our stock screening tool. NASDAQ:GMAB is showcasing impressive growth figures and is well-positioned in terms of profitability, solvency, and liquidity. Moreover, it seems to be priced reasonably. Let's dive deeper into the analysis.
How We Gauge Growth for NASDAQ:GMAB
Every stock receives a Growth Rating from ChartMill, ranging from 0 to 10. This rating assesses various growth aspects, including historical and projected EPS and revenue growth. NASDAQ:GMAB boasts a 8 out of 10:
- GMAB shows a strong growth in Earnings Per Share. In the last year, the EPS has been growing by 16.52%, which is quite good.
- Measured over the past years, GMAB shows a very strong growth in Earnings Per Share. The EPS has been growing by 22.70% on average per year.
- GMAB shows quite a strong growth in Revenue. In the last year, the Revenue has grown by 15.89%.
- GMAB shows a strong growth in Revenue. Measured over the last years, the Revenue has been growing by 40.35% yearly.
- The Earnings Per Share is expected to grow by 23.65% on average over the next years. This is a very strong growth
- Based on estimates for the next years, GMAB will show a quite strong growth in Revenue. The Revenue will grow by 17.51% on average per year.
ChartMill's Evaluation of Valuation
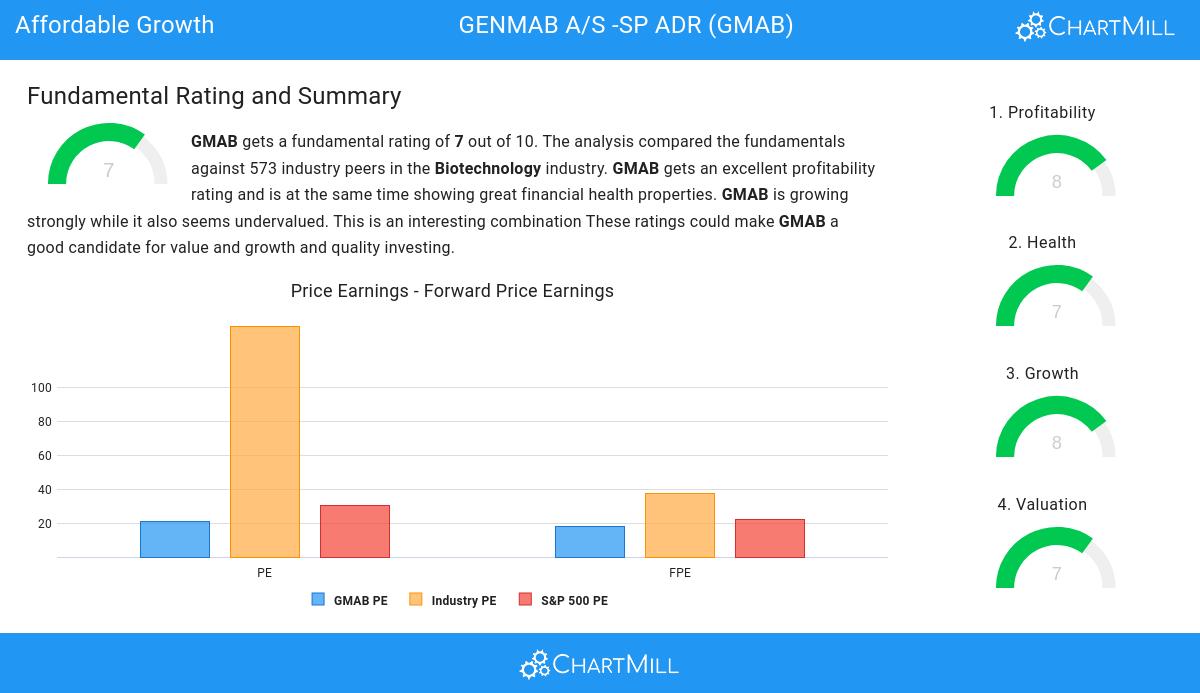
ChartMill assigns a proprietary Valuation Rating to each stock. The score is computed by evaluating various valuation aspects, like price to earnings and free cash flow, both absolutely as relative to the market and industry. NASDAQ:GMAB was assigned a score of 7 for valuation:
- GMAB's Price/Earnings ratio is rather cheap when compared to the industry. GMAB is cheaper than 96.48% of the companies in the same industry.
- Compared to an average S&P500 Price/Earnings ratio of 30.52, GMAB is valued a bit cheaper.
- GMAB's Price/Forward Earnings ratio is rather cheap when compared to the industry. GMAB is cheaper than 95.25% of the companies in the same industry.
- 96.48% of the companies in the same industry are more expensive than GMAB, based on the Enterprise Value to EBITDA ratio.
- Based on the Price/Free Cash Flow ratio, GMAB is valued cheaply inside the industry as 97.71% of the companies are valued more expensively.
- GMAB's low PEG Ratio(NY), which compensates the Price/Earnings for growth, indicates a rather cheap valuation of the company.
- GMAB has an outstanding profitability rating, which may justify a higher PE ratio.
- GMAB's earnings are expected to grow with 24.30% in the coming years. This may justify a more expensive valuation.
How do we evaluate the Health for NASDAQ:GMAB?
ChartMill employs its own Health Rating for stock assessment. This rating, ranging from 0 to 10, is calculated by examining various liquidity and solvency ratios. In the case of NASDAQ:GMAB, the assigned 7 reflects its health status:
- GMAB has an Altman-Z score of 11.23. This indicates that GMAB is financially healthy and has little risk of bankruptcy at the moment.
- With an excellent Altman-Z score value of 11.23, GMAB belongs to the best of the industry, outperforming 86.97% of the companies in the same industry.
- The Debt to FCF ratio of GMAB is 0.16, which is an excellent value as it means it would take GMAB, only 0.16 years of fcf income to pay off all of its debts.
- The Debt to FCF ratio of GMAB (0.16) is better than 97.89% of its industry peers.
- GMAB has a Debt/Equity ratio of 0.03. This is a healthy value indicating a solid balance between debt and equity.
- A Current Ratio of 5.03 indicates that GMAB has no problem at all paying its short term obligations.
- A Quick Ratio of 5.02 indicates that GMAB has no problem at all paying its short term obligations.
Exploring NASDAQ:GMAB's Profitability
ChartMill utilizes a Profitability Rating to assess stocks, scoring them on a scale of 0 to 10. This rating takes into account a variety of profitability ratios and margins, both in absolute terms and in comparison to industry peers. NASDAQ:GMAB has earned a 8 out of 10:
- Looking at the Return On Assets, with a value of 14.25%, GMAB belongs to the top of the industry, outperforming 98.24% of the companies in the same industry.
- GMAB has a Return On Equity of 17.77%. This is amongst the best in the industry. GMAB outperforms 97.01% of its industry peers.
- GMAB has a better Return On Invested Capital (13.65%) than 96.65% of its industry peers.
- The last Return On Invested Capital (13.65%) for GMAB is above the 3 year average (13.32%), which is a sign of increasing profitability.
- GMAB's Profit Margin of 29.01% is amongst the best of the industry. GMAB outperforms 98.06% of its industry peers.
- GMAB's Operating Margin of 31.65% is amongst the best of the industry. GMAB outperforms 98.77% of its industry peers.
- With an excellent Gross Margin value of 96.83%, GMAB belongs to the best of the industry, outperforming 97.36% of the companies in the same industry.
More Affordable Growth stocks can be found in our Affordable Growth screener.
Check the latest full fundamental report of GMAB for a complete fundamental analysis.
Disclaimer
This article should in no way be interpreted as advice. The article is based on the observed metrics at the time of writing, but you should always make your own analysis and trade or invest at your own responsibility.