
Uncover the potential of GLOBE LIFE INC (NYSE:GL) as our stock screener's choice for an undervalued stock. NYSE:GL maintains a strong financial position and offers an appealing valuation. We'll delve into the specifics below.
A Closer Look at Valuation for NYSE:GL
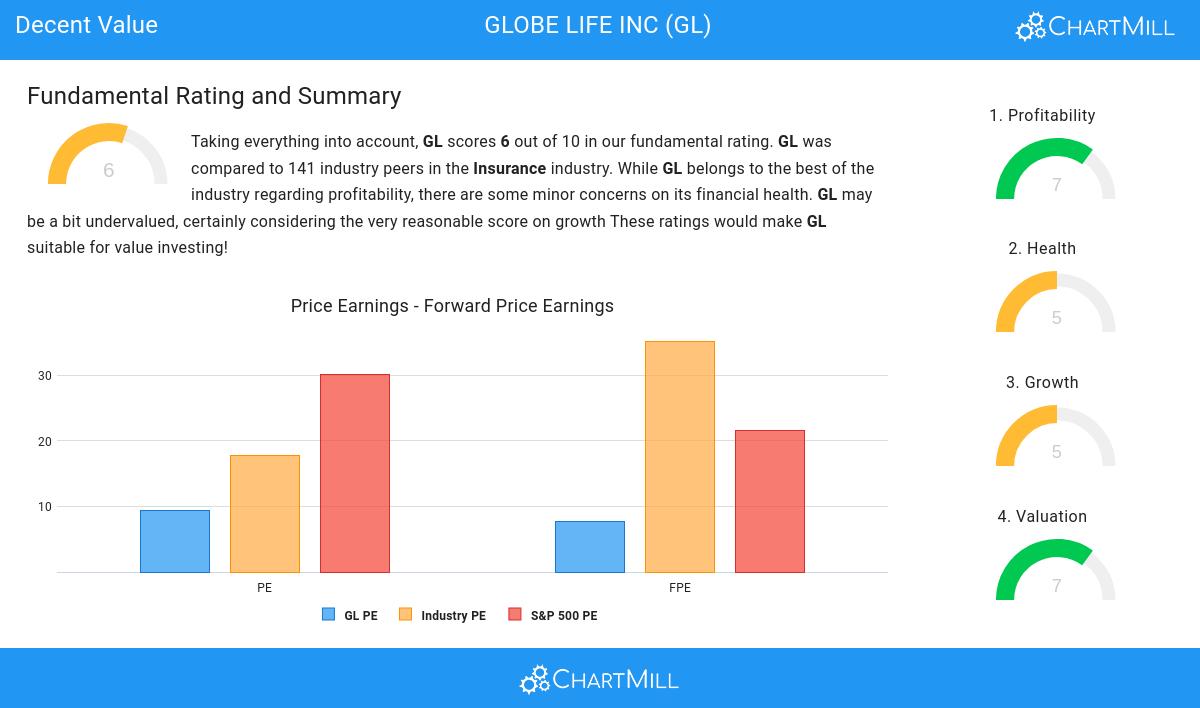
ChartMill provides a Valuation Rating to every stock, ranging from 0 to 10. This rating assesses various valuation aspects, comparing price to earnings and cash flows, while considering factors like profitability and growth. NYSE:GL boasts a 7 out of 10:
- A Price/Earnings ratio of 9.34 indicates a reasonable valuation of GL.
- 64.29% of the companies in the same industry are more expensive than GL, based on the Price/Earnings ratio.
- When comparing the Price/Earnings ratio of GL to the average of the S&P500 Index (30.14), we can say GL is valued rather cheaply.
- A Price/Forward Earnings ratio of 7.75 indicates a rather cheap valuation of GL.
- Compared to the rest of the industry, the Price/Forward Earnings ratio of GL indicates a somewhat cheap valuation: GL is cheaper than 70.71% of the companies listed in the same industry.
- Compared to an average S&P500 Price/Forward Earnings ratio of 21.56, GL is valued rather cheaply.
- Compared to the rest of the industry, the Enterprise Value to EBITDA ratio of GL indicates a somewhat cheap valuation: GL is cheaper than 73.57% of the companies listed in the same industry.
- GL's low PEG Ratio(NY), which compensates the Price/Earnings for growth, indicates a rather cheap valuation of the company.
- GL has a very decent profitability rating, which may justify a higher PE ratio.
- GL's earnings are expected to grow with 12.02% in the coming years. This may justify a more expensive valuation.
How do we evaluate the Profitability for NYSE:GL?
ChartMill utilizes a Profitability Rating to assess stocks, scoring them on a scale of 0 to 10. This rating takes into account a variety of profitability ratios and margins, both in absolute terms and in comparison to industry peers. NYSE:GL has earned a 7 out of 10:
- GL has a better Return On Assets (3.69%) than 75.00% of its industry peers.
- GL's Return On Equity of 19.98% is amongst the best of the industry. GL outperforms 80.71% of its industry peers.
- GL's Return On Invested Capital of 4.17% is fine compared to the rest of the industry. GL outperforms 77.14% of its industry peers.
- The 3 year average ROIC (3.89%) for GL is below the current ROIC(4.17%), indicating increased profibility in the last year.
- GL's Profit Margin of 18.47% is amongst the best of the industry. GL outperforms 84.29% of its industry peers.
- In the last couple of years the Profit Margin of GL has grown nicely.
- GL has a better Operating Margin (24.89%) than 85.00% of its industry peers.
Evaluating Health: NYSE:GL
ChartMill assigns a proprietary Health Rating to each stock. The score is computed by evaluating various liquidity and solvency ratios and ranges from 0 to 10. NYSE:GL was assigned a score of 5 for health:
- GL's Altman-Z score of 0.98 is amongst the best of the industry. GL outperforms 82.86% of its industry peers.
- GL has a debt to FCF ratio of 1.69. This is a very positive value and a sign of high solvency as it would only need 1.69 years to pay back of all of its debts.
- A Debt/Equity ratio of 0.40 indicates that GL is not too dependend on debt financing.
- With a decent Current ratio value of 0.48, GL is doing good in the industry, outperforming 74.29% of the companies in the same industry.
- Looking at the Quick ratio, with a value of 0.48, GL is in the better half of the industry, outperforming 74.29% of the companies in the same industry.
How We Gauge Growth for NYSE:GL
ChartMill assigns a proprietary Growth Rating to each stock. The score is computed by evaluating various growth aspects, like EPS and revenue growth. We take into account the history as well as the estimated future numbers. NYSE:GL was assigned a score of 5 for growth:
- The Earnings Per Share has grown by an nice 18.15% over the past year.
- The Earnings Per Share has been growing by 11.68% on average over the past years. This is quite good.
- Based on estimates for the next years, GL will show a quite strong growth in Earnings Per Share. The EPS will grow by 10.29% on average per year.
- The Revenue growth rate is accelerating: in the next years the growth will be better than in the last years.
Our Decent Value screener lists more Decent Value stocks and is updated daily.
Check the latest full fundamental report of GL for a complete fundamental analysis.
Disclaimer
Important Note: The content of this article is not intended as trading advice. It is essential to perform your own analysis and exercise caution when making trading decisions. The article presents observations created by automated analysis but does not guarantee any trading or investment outcomes. Always trade responsibly and make independent judgments.