
NYSE:GD is a prime example of a stock that offers more than what meets the eye in terms of fundamentals.
By Mill Chart
Last update: Feb 4, 2025
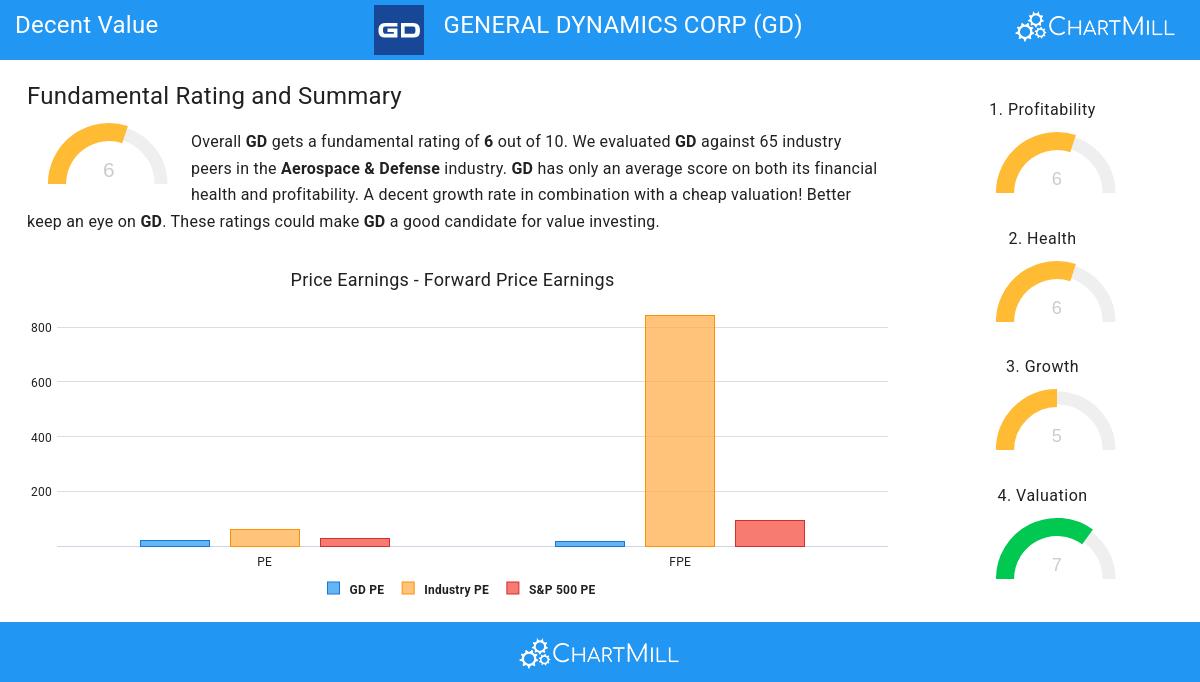
Discover GENERAL DYNAMICS CORP (NYSE:GD), an undervalued stock highlighted by our stock screener. NYSE:GD showcases solid financial health and profitability while maintaining an appealing valuation. We'll explore the details.
ChartMill's Evaluation of Valuation
To assess a stock's valuation, ChartMill utilizes a Valuation Rating on a scale of 0 to 10. This comprehensive assessment considers various valuation aspects, comparing price to earnings and cash flows, while factoring in profitability and growth. NYSE:GD has achieved a 7 out of 10:
- Based on the Price/Earnings ratio, GD is valued cheaply inside the industry as 85.94% of the companies are valued more expensively.
- When comparing the Price/Earnings ratio of GD to the average of the S&P500 Index (28.36), we can say GD is valued slightly cheaper.
- Compared to the rest of the industry, the Price/Forward Earnings ratio of GD indicates a rather cheap valuation: GD is cheaper than 92.19% of the companies listed in the same industry.
- The average S&P500 Price/Forward Earnings ratio is at 92.49. GD is valued rather cheaply when compared to this.
- GD's Enterprise Value to EBITDA ratio is rather cheap when compared to the industry. GD is cheaper than 82.81% of the companies in the same industry.
- Based on the Price/Free Cash Flow ratio, GD is valued cheaper than 95.31% of the companies in the same industry.
- GD's low PEG Ratio(NY), which compensates the Price/Earnings for growth, indicates a rather cheap valuation of the company.
- GD has a very decent profitability rating, which may justify a higher PE ratio.
- A more expensive valuation may be justified as GD's earnings are expected to grow with 13.34% in the coming years.
Profitability Insights: NYSE:GD
ChartMill assigns a Profitability Rating to every stock. This score ranges from 0 to 10 and evaluates the different profitability ratios and margins, both absolutely, but also relative to the industry peers. NYSE:GD scores a 6 out of 10:
- GD has a Return On Assets of 6.77%. This is in the better half of the industry: GD outperforms 75.00% of its industry peers.
- GD's Return On Equity of 17.14% is amongst the best of the industry. GD outperforms 87.50% of its industry peers.
- The Return On Invested Capital of GD (10.49%) is better than 87.50% of its industry peers.
- The Average Return On Invested Capital over the past 3 years for GD is above the industry average of 7.69%.
- The 3 year average ROIC (9.79%) for GD is below the current ROIC(10.49%), indicating increased profibility in the last year.
- Looking at the Profit Margin, with a value of 7.93%, GD is in the better half of the industry, outperforming 70.31% of the companies in the same industry.
- GD's Operating Margin of 10.05% is fine compared to the rest of the industry. GD outperforms 67.19% of its industry peers.
ChartMill's Evaluation of Health
To gauge a stock's financial health, ChartMill utilizes a Health Rating on a scale of 0 to 10. This comprehensive evaluation encompasses liquidity and solvency, both in absolute terms and in comparison to industry peers. NYSE:GD has earned a 6 out of 10:
- GD has an Altman-Z score of 3.57. This indicates that GD is financially healthy and has little risk of bankruptcy at the moment.
- GD has a debt to FCF ratio of 2.75. This is a good value and a sign of high solvency as GD would need 2.75 years to pay back of all of its debts.
- GD's Debt to FCF ratio of 2.75 is amongst the best of the industry. GD outperforms 89.06% of its industry peers.
- GD has a Debt/Equity ratio of 0.33. This is a healthy value indicating a solid balance between debt and equity.
- GD has a better Debt to Equity ratio (0.33) than 67.19% of its industry peers.
Evaluating Growth: NYSE:GD
ChartMill assigns a Growth Rating to every stock. This score ranges from 0 to 10 and evaluates the different growth aspects like EPS and Revenue, both in the past as in the future. NYSE:GD scores a 5 out of 10:
- GD shows a strong growth in Earnings Per Share. In the last year, the EPS has been growing by 13.48%, which is quite good.
- GD shows quite a strong growth in Revenue. In the last year, the Revenue has grown by 12.88%.
- The Earnings Per Share is expected to grow by 11.17% on average over the next years. This is quite good.
- The EPS growth rate is accelerating: in the next years the growth will be better than in the last years.
Our Decent Value screener lists more Decent Value stocks and is updated daily.
Our latest full fundamental report of GD contains the most current fundamental analsysis.
Disclaimer
Important Note: The content of this article is not intended as trading advice. It is essential to perform your own analysis and exercise caution when making trading decisions. The article presents observations created by automated analysis but does not guarantee any trading or investment outcomes. Always trade responsibly and make independent judgments.