
NASDAQ:GCT stands out as a growth opportunity that won't break the bank.
By Mill Chart
Last update: Oct 21, 2024
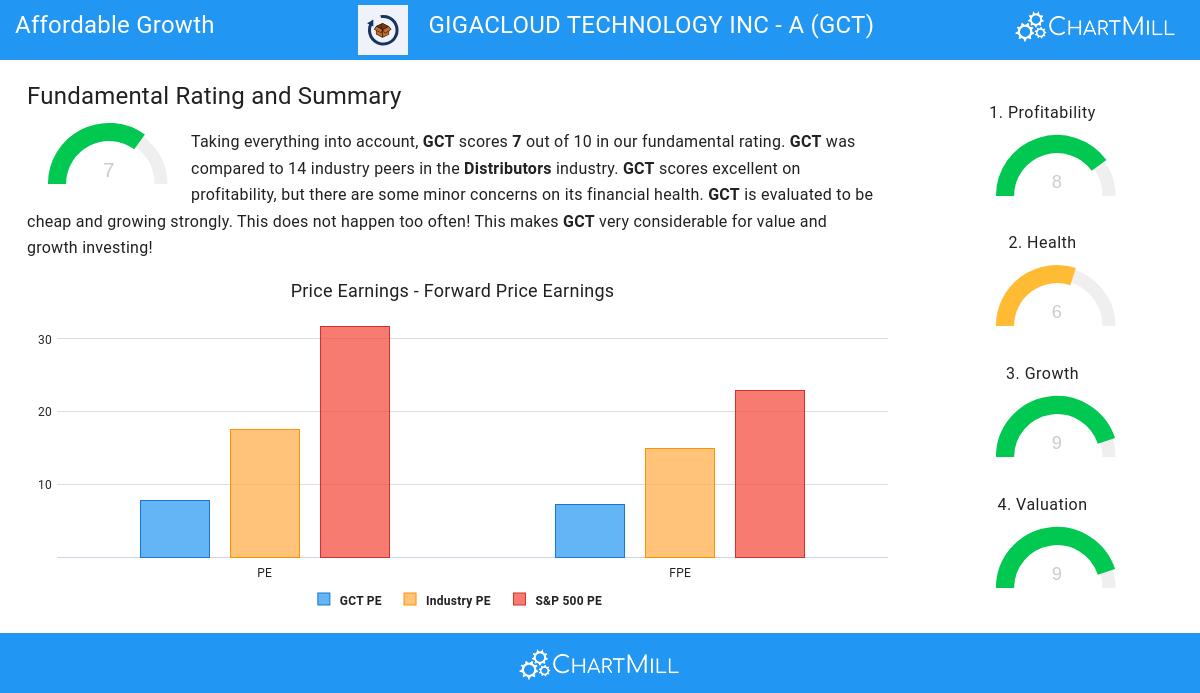
Our stock screener has spotted GIGACLOUD TECHNOLOGY INC - A (NASDAQ:GCT) as a growth stock which is not overvalued. NASDAQ:GCT is scoring great on several growth aspects while it also shows decent health and profitability. At the same time it remains remains attractively priced. We'll dive into each aspect below.
Understanding NASDAQ:GCT's Growth Score
Every stock receives a Growth Rating from ChartMill, ranging from 0 to 10. This rating assesses various growth aspects, including historical and projected EPS and revenue growth. NASDAQ:GCT boasts a 9 out of 10:
- GCT shows a strong growth in Earnings Per Share. In the last year, the EPS has been growing by 192.01%, which is quite impressive.
- GCT shows a strong growth in Earnings Per Share. Measured over the last years, the EPS has been growing by 92.98% yearly.
- The Revenue has grown by 84.26% in the past year. This is a very strong growth!
- Measured over the past years, GCT shows a very strong growth in Revenue. The Revenue has been growing by 36.70% on average per year.
- Based on estimates for the next years, GCT will show a very strong growth in Earnings Per Share. The EPS will grow by 29.77% on average per year.
- The Revenue is expected to grow by 34.34% on average over the next years. This is a very strong growth
Valuation Analysis for NASDAQ:GCT
ChartMill assigns a Valuation Rating to every stock. This score ranges from 0 to 10 and evaluates the different valuation aspects and compares the price to earnings and cash flows, while taking into account profitability and growth. NASDAQ:GCT scores a 9 out of 10:
- With a Price/Earnings ratio of 7.76, the valuation of GCT can be described as very cheap.
- GCT's Price/Earnings ratio is rather cheap when compared to the industry. GCT is cheaper than 100.00% of the companies in the same industry.
- GCT is valuated cheaply when we compare the Price/Earnings ratio to 31.71, which is the current average of the S&P500 Index.
- With a Price/Forward Earnings ratio of 7.21, the valuation of GCT can be described as very cheap.
- Based on the Price/Forward Earnings ratio, GCT is valued cheaply inside the industry as 100.00% of the companies are valued more expensively.
- The average S&P500 Price/Forward Earnings ratio is at 22.81. GCT is valued rather cheaply when compared to this.
- Based on the Enterprise Value to EBITDA ratio, GCT is valued cheaply inside the industry as 92.31% of the companies are valued more expensively.
- GCT's Price/Free Cash Flow ratio is a bit cheaper when compared to the industry. GCT is cheaper than 61.54% of the companies in the same industry.
- The low PEG Ratio(NY), which compensates the Price/Earnings for growth, indicates a rather cheap valuation of the company.
- GCT has an outstanding profitability rating, which may justify a higher PE ratio.
- GCT's earnings are expected to grow with 29.77% in the coming years. This may justify a more expensive valuation.
Health Insights: NASDAQ:GCT
ChartMill assigns a proprietary Health Rating to each stock. The score is computed by evaluating various liquidity and solvency ratios and ranges from 0 to 10. NASDAQ:GCT was assigned a score of 6 for health:
- The Debt to FCF ratio of GCT is 0.00, which is an excellent value as it means it would take GCT, only 0.00 years of fcf income to pay off all of its debts.
- The Debt to FCF ratio of GCT (0.00) is better than 84.62% of its industry peers.
- GCT has a Debt/Equity ratio of 0.00. This is a healthy value indicating a solid balance between debt and equity.
- With a decent Debt to Equity ratio value of 0.00, GCT is doing good in the industry, outperforming 76.92% of the companies in the same industry.
- GCT has a better Current ratio (1.98) than 61.54% of its industry peers.
- GCT has a Quick ratio of 1.19. This is in the better half of the industry: GCT outperforms 61.54% of its industry peers.
Understanding NASDAQ:GCT's Profitability
ChartMill's Profitability Rating offers a unique perspective on stock analysis, providing scores from 0 to 10. These ratings consider a wide range of profitability metrics and margins, both in comparison to industry peers and on their own merits. For NASDAQ:GCT, the assigned 8 is a significant indicator of profitability:
- GCT has a better Return On Assets (10.80%) than 84.62% of its industry peers.
- With an excellent Return On Equity value of 31.79%, GCT belongs to the best of the industry, outperforming 84.62% of the companies in the same industry.
- GCT has a Return On Invested Capital of 13.25%. This is amongst the best in the industry. GCT outperforms 84.62% of its industry peers.
- With an excellent Profit Margin value of 11.57%, GCT belongs to the best of the industry, outperforming 92.31% of the companies in the same industry.
- In the last couple of years the Profit Margin of GCT has grown nicely.
- GCT's Operating Margin of 13.66% is amongst the best of the industry. GCT outperforms 92.31% of its industry peers.
Our Affordable Growth screener lists more Affordable Growth stocks and is updated daily.
For an up to date full fundamental analysis you can check the fundamental report of GCT
Keep in mind
This article should in no way be interpreted as advice. The article is based on the observed metrics at the time of writing, but you should always make your own analysis and trade or invest at your own responsibility.