
Consider GIGACLOUD TECHNOLOGY INC - A (NASDAQ:GCT) as a top value stock, identified by our stock screening tool. NASDAQ:GCT shines in terms of profitability, solvency, and liquidity, all while remaining very reasonably priced. Let's dive deeper into the analysis.
Valuation Examination for NASDAQ:GCT
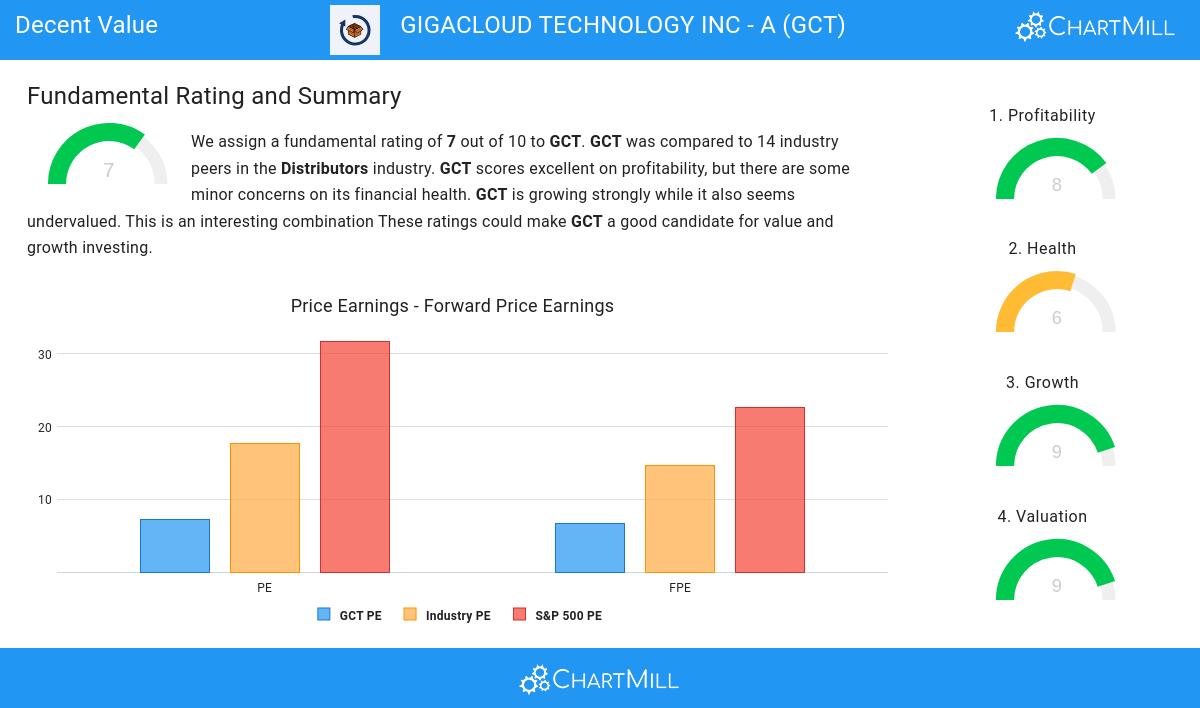
ChartMill assigns a Valuation Rating to every stock. This score ranges from 0 to 10 and evaluates the different valuation aspects and compares the price to earnings and cash flows, while taking into account profitability and growth. NASDAQ:GCT scores a 9 out of 10:
- The Price/Earnings ratio is 7.19, which indicates a rather cheap valuation of GCT.
- Based on the Price/Earnings ratio, GCT is valued cheaply inside the industry as 100.00% of the companies are valued more expensively.
- Compared to an average S&P500 Price/Earnings ratio of 31.77, GCT is valued rather cheaply.
- Based on the Price/Forward Earnings ratio of 6.67, the valuation of GCT can be described as very cheap.
- 100.00% of the companies in the same industry are more expensive than GCT, based on the Price/Forward Earnings ratio.
- When comparing the Price/Forward Earnings ratio of GCT to the average of the S&P500 Index (22.70), we can say GCT is valued rather cheaply.
- Compared to the rest of the industry, the Enterprise Value to EBITDA ratio of GCT indicates a rather cheap valuation: GCT is cheaper than 100.00% of the companies listed in the same industry.
- Based on the Price/Free Cash Flow ratio, GCT is valued a bit cheaper than the industry average as 61.54% of the companies are valued more expensively.
- GCT's low PEG Ratio(NY), which compensates the Price/Earnings for growth, indicates a rather cheap valuation of the company.
- GCT has an outstanding profitability rating, which may justify a higher PE ratio.
- GCT's earnings are expected to grow with 29.77% in the coming years. This may justify a more expensive valuation.
A Closer Look at Profitability for NASDAQ:GCT
Discover ChartMill's exclusive Profitability Rating, a proprietary metric that assesses stocks on a scale of 0 to 10. It takes into consideration various profitability ratios and margins, both in absolute terms and relative to industry peers. Notably, NASDAQ:GCT has achieved a 8:
- GCT's Return On Assets of 10.80% is amongst the best of the industry. GCT outperforms 84.62% of its industry peers.
- The Return On Equity of GCT (31.79%) is better than 84.62% of its industry peers.
- GCT has a Return On Invested Capital of 13.25%. This is amongst the best in the industry. GCT outperforms 84.62% of its industry peers.
- The Profit Margin of GCT (11.57%) is better than 92.31% of its industry peers.
- GCT's Profit Margin has improved in the last couple of years.
- The Operating Margin of GCT (13.66%) is better than 92.31% of its industry peers.
What does the Health looks like for NASDAQ:GCT
ChartMill assigns a proprietary Health Rating to each stock. The score is computed by evaluating various liquidity and solvency ratios and ranges from 0 to 10. NASDAQ:GCT was assigned a score of 6 for health:
- The Debt to FCF ratio of GCT is 0.00, which is an excellent value as it means it would take GCT, only 0.00 years of fcf income to pay off all of its debts.
- GCT's Debt to FCF ratio of 0.00 is amongst the best of the industry. GCT outperforms 84.62% of its industry peers.
- GCT has a Debt/Equity ratio of 0.00. This is a healthy value indicating a solid balance between debt and equity.
- The Debt to Equity ratio of GCT (0.00) is better than 76.92% of its industry peers.
- Looking at the Current ratio, with a value of 1.98, GCT is in the better half of the industry, outperforming 61.54% of the companies in the same industry.
- GCT's Quick ratio of 1.19 is fine compared to the rest of the industry. GCT outperforms 61.54% of its industry peers.
Growth Analysis for NASDAQ:GCT
ChartMill assigns a Growth Rating to each stock, ranging from 0 to 10. This rating is determined by analyzing different growth elements, including EPS and revenue growth, spanning both historical and future figures. In the case of NASDAQ:GCT, the assigned 9 reflects its growth potential:
- GCT shows a strong growth in Earnings Per Share. In the last year, the EPS has been growing by 192.01%, which is quite impressive.
- GCT shows a strong growth in Earnings Per Share. Measured over the last years, the EPS has been growing by 92.98% yearly.
- The Revenue has grown by 84.26% in the past year. This is a very strong growth!
- Measured over the past years, GCT shows a very strong growth in Revenue. The Revenue has been growing by 36.70% on average per year.
- GCT is expected to show a strong growth in Earnings Per Share. In the coming years, the EPS will grow by 29.77% yearly.
- The Revenue is expected to grow by 34.34% on average over the next years. This is a very strong growth
More Decent Value stocks can be found in our Decent Value screener.
Check the latest full fundamental report of GCT for a complete fundamental analysis.
Keep in mind
This article should in no way be interpreted as advice. The article is based on the observed metrics at the time of writing, but you should always make your own analysis and trade or invest at your own responsibility.
