
While growth is established for NASDAQ:GCT, the stock's valuation remains reasonable.
By Mill Chart
Last update: Sep 30, 2024
Here's GIGACLOUD TECHNOLOGY INC - A (NASDAQ:GCT) for you, a growth stock our stock screener believes is undervalued. NASDAQ:GCT is scoring impressively in terms of growth while demonstrating strong financials. On top of that, it remains attractively priced. Let's break it down further.
Assessing Growth for NASDAQ:GCT
ChartMill assigns a Growth Rating to every stock. This score ranges from 0 to 10 and evaluates the different growth aspects like EPS and Revenue, both in the past as in the future. NASDAQ:GCT scores a 9 out of 10:
- GCT shows a strong growth in Earnings Per Share. In the last year, the EPS has been growing by 192.01%, which is quite impressive.
- GCT shows a strong growth in Earnings Per Share. Measured over the last years, the EPS has been growing by 92.98% yearly.
- GCT shows a strong growth in Revenue. In the last year, the Revenue has grown by 84.26%.
- GCT shows a strong growth in Revenue. Measured over the last years, the Revenue has been growing by 36.70% yearly.
- The Earnings Per Share is expected to grow by 29.77% on average over the next years. This is a very strong growth
- The Revenue is expected to grow by 34.34% on average over the next years. This is a very strong growth
Evaluating Valuation: NASDAQ:GCT
ChartMill provides a Valuation Rating to every stock, ranging from 0 to 10. This rating assesses various valuation aspects, comparing price to earnings and cash flows, while considering factors like profitability and growth. NASDAQ:GCT boasts a 9 out of 10:
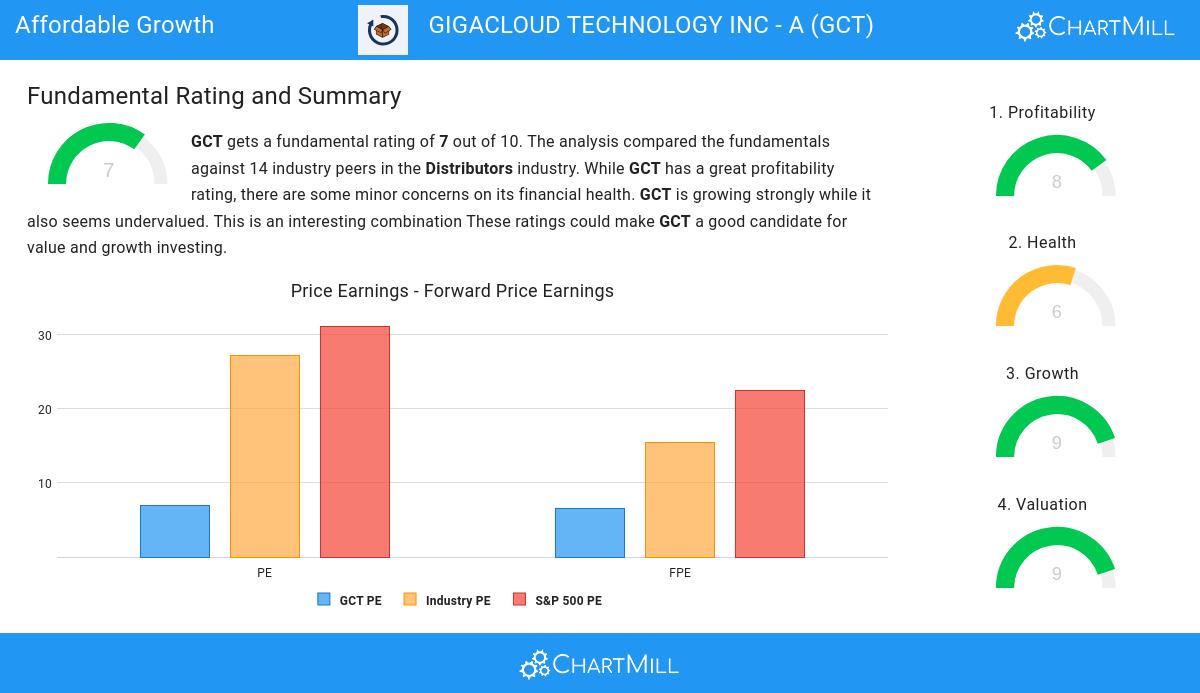
- The Price/Earnings ratio is 6.99, which indicates a rather cheap valuation of GCT.
- GCT's Price/Earnings ratio is rather cheap when compared to the industry. GCT is cheaper than 100.00% of the companies in the same industry.
- When comparing the Price/Earnings ratio of GCT to the average of the S&P500 Index (31.19), we can say GCT is valued rather cheaply.
- GCT is valuated cheaply with a Price/Forward Earnings ratio of 6.49.
- Based on the Price/Forward Earnings ratio, GCT is valued cheaply inside the industry as 100.00% of the companies are valued more expensively.
- When comparing the Price/Forward Earnings ratio of GCT to the average of the S&P500 Index (22.50), we can say GCT is valued rather cheaply.
- GCT's Enterprise Value to EBITDA ratio is rather cheap when compared to the industry. GCT is cheaper than 100.00% of the companies in the same industry.
- 69.23% of the companies in the same industry are more expensive than GCT, based on the Price/Free Cash Flow ratio.
- GCT's low PEG Ratio(NY), which compensates the Price/Earnings for growth, indicates a rather cheap valuation of the company.
- GCT has an outstanding profitability rating, which may justify a higher PE ratio.
- A more expensive valuation may be justified as GCT's earnings are expected to grow with 29.77% in the coming years.
Assessing Health for NASDAQ:GCT
ChartMill assigns a Health Rating to every stock. This score ranges from 0 to 10 and evaluates the different health aspects like liquidity and solvency, both absolutely, but also relative to the industry peers. NASDAQ:GCT scores a 6 out of 10:
- GCT has a debt to FCF ratio of 0.00. This is a very positive value and a sign of high solvency as it would only need 0.00 years to pay back of all of its debts.
- GCT has a better Debt to FCF ratio (0.00) than 84.62% of its industry peers.
- GCT has a Debt/Equity ratio of 0.00. This is a healthy value indicating a solid balance between debt and equity.
- GCT's Debt to Equity ratio of 0.00 is fine compared to the rest of the industry. GCT outperforms 76.92% of its industry peers.
- With a decent Current ratio value of 1.98, GCT is doing good in the industry, outperforming 61.54% of the companies in the same industry.
- GCT's Quick ratio of 1.19 is fine compared to the rest of the industry. GCT outperforms 69.23% of its industry peers.
Looking at the Profitability
ChartMill assigns a Profitability Rating to every stock. This score ranges from 0 to 10 and evaluates the different profitability ratios and margins, both absolutely, but also relative to the industry peers. NASDAQ:GCT scores a 8 out of 10:
- Looking at the Return On Assets, with a value of 10.80%, GCT belongs to the top of the industry, outperforming 84.62% of the companies in the same industry.
- GCT has a Return On Equity of 31.79%. This is amongst the best in the industry. GCT outperforms 84.62% of its industry peers.
- GCT's Return On Invested Capital of 13.25% is amongst the best of the industry. GCT outperforms 84.62% of its industry peers.
- Looking at the Profit Margin, with a value of 11.57%, GCT belongs to the top of the industry, outperforming 92.31% of the companies in the same industry.
- GCT's Profit Margin has improved in the last couple of years.
- With an excellent Operating Margin value of 13.66%, GCT belongs to the best of the industry, outperforming 92.31% of the companies in the same industry.
Every day, new Affordable Growth stocks can be found on ChartMill in our Affordable Growth screener.
Check the latest full fundamental report of GCT for a complete fundamental analysis.
Disclaimer
Important Note: The content of this article is not intended as trading advice. It is essential to perform your own analysis and exercise caution when making trading decisions. The article presents observations created by automated analysis but does not guarantee any trading or investment outcomes. Always trade responsibly and make independent judgments.