
NASDAQ:GCT is an undervalued gem with solid fundamentals.
By Mill Chart
Last update: Sep 27, 2024
Our stock screening tool has pinpointed GIGACLOUD TECHNOLOGY INC - A (NASDAQ:GCT) as an undervalued stock. NASDAQ:GCT maintains a solid financial footing. Furthermore, it remains attractively priced. Let's delve into the specifics below.
Understanding NASDAQ:GCT's Valuation
ChartMill assigns a Valuation Rating to every stock. This score ranges from 0 to 10 and evaluates the different valuation aspects and compares the price to earnings and cash flows, while taking into account profitability and growth. NASDAQ:GCT scores a 9 out of 10:
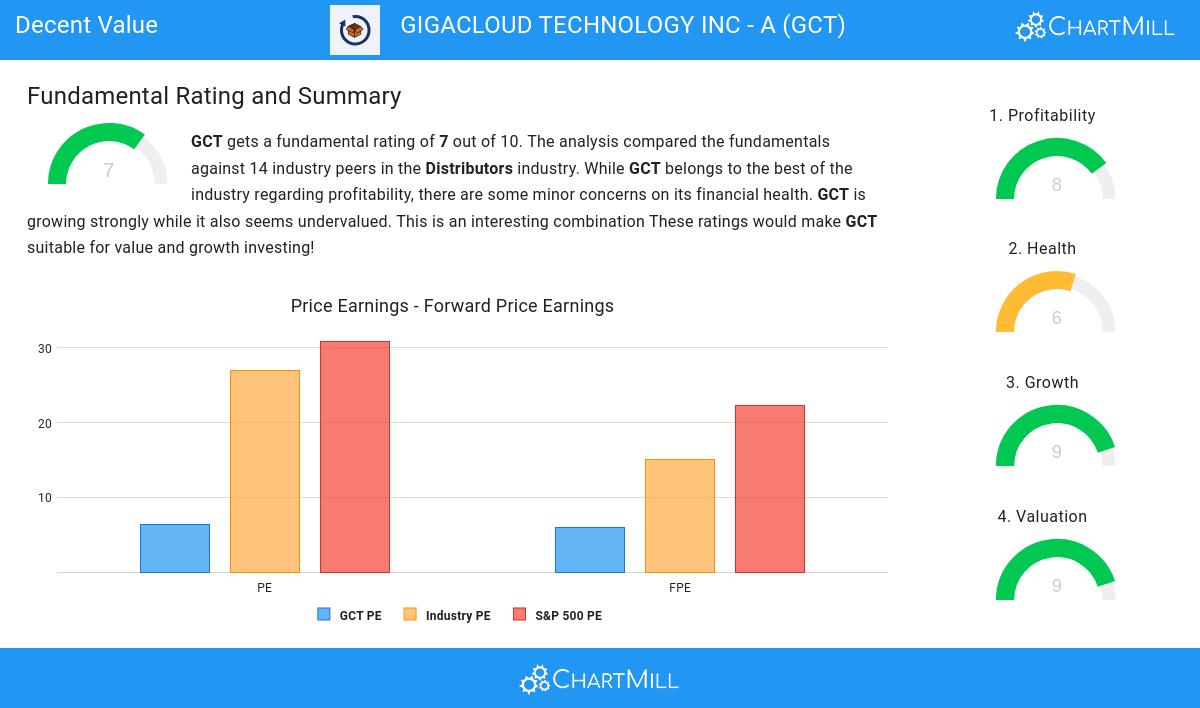
- Based on the Price/Earnings ratio of 6.39, the valuation of GCT can be described as very cheap.
- Based on the Price/Earnings ratio, GCT is valued cheaply inside the industry as 100.00% of the companies are valued more expensively.
- GCT is valuated cheaply when we compare the Price/Earnings ratio to 30.91, which is the current average of the S&P500 Index.
- A Price/Forward Earnings ratio of 5.93 indicates a rather cheap valuation of GCT.
- Based on the Price/Forward Earnings ratio, GCT is valued cheaply inside the industry as 100.00% of the companies are valued more expensively.
- When comparing the Price/Forward Earnings ratio of GCT to the average of the S&P500 Index (22.30), we can say GCT is valued rather cheaply.
- GCT's Enterprise Value to EBITDA ratio is rather cheap when compared to the industry. GCT is cheaper than 100.00% of the companies in the same industry.
- Compared to the rest of the industry, the Price/Free Cash Flow ratio of GCT indicates a somewhat cheap valuation: GCT is cheaper than 69.23% of the companies listed in the same industry.
- GCT's low PEG Ratio(NY), which compensates the Price/Earnings for growth, indicates a rather cheap valuation of the company.
- The excellent profitability rating of GCT may justify a higher PE ratio.
- A more expensive valuation may be justified as GCT's earnings are expected to grow with 29.77% in the coming years.
How do we evaluate the Profitability for NASDAQ:GCT?
ChartMill utilizes a Profitability Rating to assess stocks, scoring them on a scale of 0 to 10. This rating takes into account a variety of profitability ratios and margins, both in absolute terms and in comparison to industry peers. NASDAQ:GCT has earned a 8 out of 10:
- The Return On Assets of GCT (10.80%) is better than 84.62% of its industry peers.
- With an excellent Return On Equity value of 31.79%, GCT belongs to the best of the industry, outperforming 84.62% of the companies in the same industry.
- With an excellent Return On Invested Capital value of 13.25%, GCT belongs to the best of the industry, outperforming 84.62% of the companies in the same industry.
- Looking at the Profit Margin, with a value of 11.57%, GCT belongs to the top of the industry, outperforming 92.31% of the companies in the same industry.
- GCT's Profit Margin has improved in the last couple of years.
- GCT has a better Operating Margin (13.66%) than 92.31% of its industry peers.
Understanding NASDAQ:GCT's Health Score
A critical element of ChartMill's stock evaluation is the Health Rating, which spans from 0 to 10. This rating considers multiple health factors, including liquidity and solvency, both in absolute terms and relative to industry peers. NASDAQ:GCT has received a 6 out of 10:
- GCT has a debt to FCF ratio of 0.00. This is a very positive value and a sign of high solvency as it would only need 0.00 years to pay back of all of its debts.
- The Debt to FCF ratio of GCT (0.00) is better than 84.62% of its industry peers.
- A Debt/Equity ratio of 0.00 indicates that GCT is not too dependend on debt financing.
- GCT has a Debt to Equity ratio of 0.00. This is in the better half of the industry: GCT outperforms 76.92% of its industry peers.
- GCT has a Current ratio of 1.98. This is in the better half of the industry: GCT outperforms 61.54% of its industry peers.
- GCT has a Quick ratio of 1.19. This is in the better half of the industry: GCT outperforms 69.23% of its industry peers.
A Closer Look at Growth for NASDAQ:GCT
ChartMill assigns a Growth Rating to every stock. This score ranges from 0 to 10 and evaluates the different growth aspects like EPS and Revenue, both in the past as in the future. NASDAQ:GCT scores a 9 out of 10:
- GCT shows a strong growth in Earnings Per Share. In the last year, the EPS has been growing by 192.01%, which is quite impressive.
- The Earnings Per Share has been growing by 92.98% on average over the past years. This is a very strong growth
- The Revenue has grown by 84.26% in the past year. This is a very strong growth!
- Measured over the past years, GCT shows a very strong growth in Revenue. The Revenue has been growing by 36.70% on average per year.
- GCT is expected to show a strong growth in Earnings Per Share. In the coming years, the EPS will grow by 29.77% yearly.
- The Revenue is expected to grow by 34.34% on average over the next years. This is a very strong growth
More Decent Value stocks can be found in our Decent Value screener.
Our latest full fundamental report of GCT contains the most current fundamental analsysis.
Keep in mind
Important Note: The content of this article is not intended as trading advice. It is essential to perform your own analysis and exercise caution when making trading decisions. The article presents observations created by automated analysis but does not guarantee any trading or investment outcomes. Always trade responsibly and make independent judgments.