
NYSE:GAP is a prime example of a stock that offers more than what meets the eye in terms of fundamentals.
By Mill Chart
Last update: Feb 20, 2025
Consider GAP INC/THE (NYSE:GAP) as a top value stock, identified by our stock screening tool. NYSE:GAP shines in terms of profitability, solvency, and liquidity, all while remaining very reasonably priced. Let's dive deeper into the analysis.
ChartMill's Evaluation of Valuation
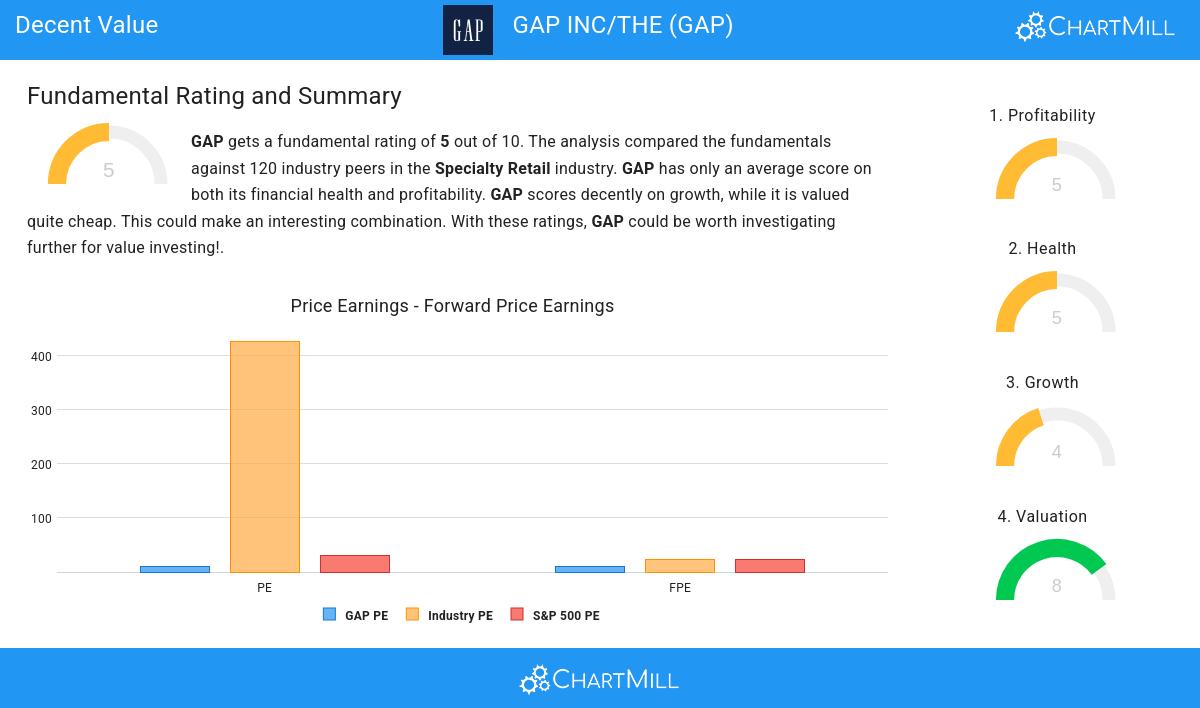
ChartMill employs its own Valuation Rating system for all stocks. This score, ranging from 0 to 10, is determined by evaluating different valuation factors, including price to earnings and free cash flow, both in absolute terms and relative to the market and industry. NYSE:GAP has earned a 8 for valuation:
- Based on the Price/Earnings ratio of 10.65, the valuation of GAP can be described as reasonable.
- Based on the Price/Earnings ratio, GAP is valued cheaper than 89.74% of the companies in the same industry.
- The average S&P500 Price/Earnings ratio is at 30.42. GAP is valued rather cheaply when compared to this.
- With a Price/Forward Earnings ratio of 10.54, the valuation of GAP can be described as very reasonable.
- Based on the Price/Forward Earnings ratio, GAP is valued cheaper than 82.05% of the companies in the same industry.
- The average S&P500 Price/Forward Earnings ratio is at 23.75. GAP is valued rather cheaply when compared to this.
- 88.89% of the companies in the same industry are more expensive than GAP, based on the Enterprise Value to EBITDA ratio.
- Based on the Price/Free Cash Flow ratio, GAP is valued cheaply inside the industry as 92.31% of the companies are valued more expensively.
- GAP's low PEG Ratio(NY), which compensates the Price/Earnings for growth, indicates a rather cheap valuation of the company.
- GAP's earnings are expected to grow with 19.39% in the coming years. This may justify a more expensive valuation.
How do we evaluate the Profitability for NYSE:GAP?
Discover ChartMill's exclusive Profitability Rating, a proprietary metric that assesses stocks on a scale of 0 to 10. It takes into consideration various profitability ratios and margins, both in absolute terms and relative to industry peers. Notably, NYSE:GAP has achieved a 5:
- With a decent Return On Assets value of 6.94%, GAP is doing good in the industry, outperforming 76.07% of the companies in the same industry.
- Looking at the Return On Equity, with a value of 26.25%, GAP belongs to the top of the industry, outperforming 81.20% of the companies in the same industry.
- Looking at the Return On Invested Capital, with a value of 11.44%, GAP is in the better half of the industry, outperforming 76.92% of the companies in the same industry.
- GAP has a better Profit Margin (5.40%) than 78.63% of its industry peers.
- Looking at the Operating Margin, with a value of 7.10%, GAP is in the better half of the industry, outperforming 76.07% of the companies in the same industry.
- GAP has a Gross Margin of 41.27%. This is in the better half of the industry: GAP outperforms 62.39% of its industry peers.
Looking at the Health
ChartMill employs its own Health Rating for stock assessment. This rating, ranging from 0 to 10, is calculated by examining various liquidity and solvency ratios. In the case of NYSE:GAP, the assigned 5 reflects its health status:
- The Debt to FCF ratio of GAP is 1.34, which is an excellent value as it means it would take GAP, only 1.34 years of fcf income to pay off all of its debts.
- GAP has a better Debt to FCF ratio (1.34) than 77.78% of its industry peers.
- A Debt/Equity ratio of 0.47 indicates that GAP is not too dependend on debt financing.
- GAP has a better Current ratio (1.54) than 61.54% of its industry peers.
- GAP has a better Quick ratio (0.84) than 68.38% of its industry peers.
What does the Growth looks like for NYSE:GAP
Every stock receives a Growth Rating from ChartMill, ranging from 0 to 10. This rating assesses various growth aspects, including historical and projected EPS and revenue growth. NYSE:GAP boasts a 4 out of 10:
- The Earnings Per Share has grown by an impressive 1036.84% over the past year.
- GAP is expected to show quite a strong growth in Earnings Per Share. In the coming years, the EPS will grow by 15.10% yearly.
- The EPS growth rate is accelerating: in the next years the growth will be better than in the last years.
- The Revenue growth rate is accelerating: in the next years the growth will be better than in the last years.
Our Decent Value screener lists more Decent Value stocks and is updated daily.
For an up to date full fundamental analysis you can check the fundamental report of GAP
Disclaimer
Important Note: The content of this article is not intended as trading advice. It is essential to perform your own analysis and exercise caution when making trading decisions. The article presents observations created by automated analysis but does not guarantee any trading or investment outcomes. Always trade responsibly and make independent judgments.
