
Our stock screener has spotted GAP INC/THE (NYSE:GAP) as an undervalued stock with solid fundamentals. NYSE:GAP shows decent health and profitability. At the same time it remains remains attractively priced. We'll dive into each aspect below.
Valuation Analysis for NYSE:GAP
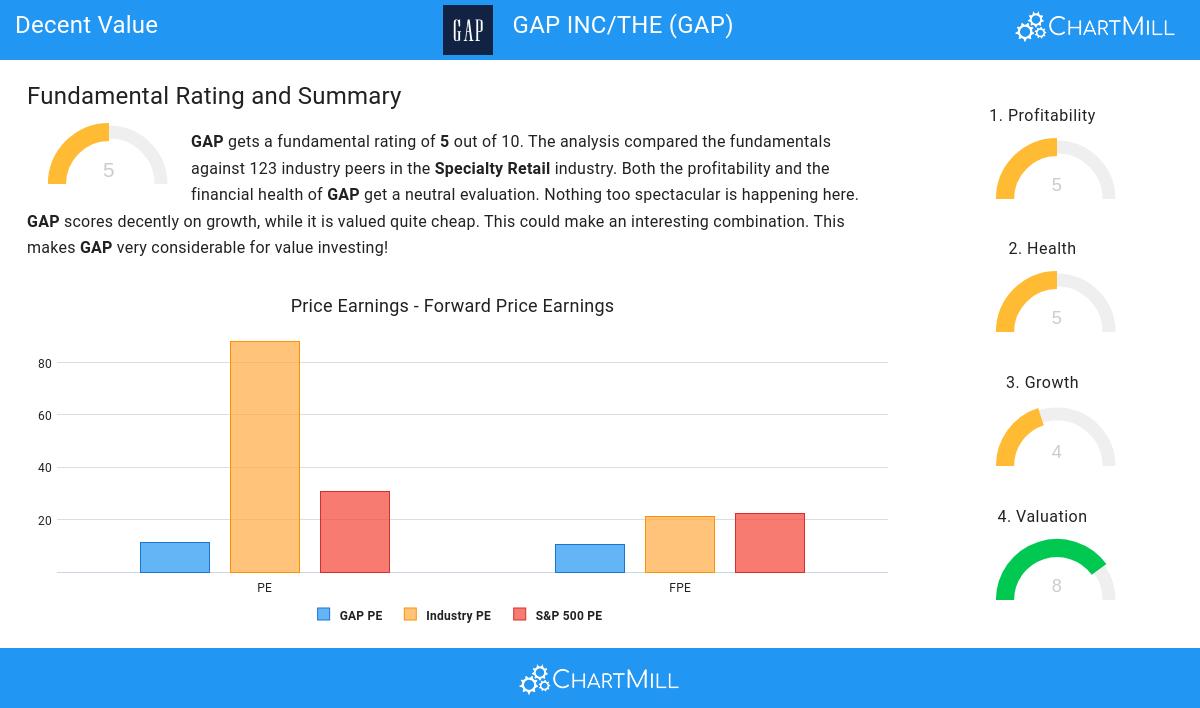
ChartMill assigns a Valuation Rating to each stock, ranging from 0 to 10. This rating is calculated by analyzing different valuation elements, such as price to earnings and free cash flow, both in absolute terms and relative to the market and industry. In the case of NYSE:GAP, the assigned 8 reflects its valuation:
- With a Price/Earnings ratio of 11.18, the valuation of GAP can be described as very reasonable.
- Compared to the rest of the industry, the Price/Earnings ratio of GAP indicates a rather cheap valuation: GAP is cheaper than 81.15% of the companies listed in the same industry.
- The average S&P500 Price/Earnings ratio is at 30.79. GAP is valued rather cheaply when compared to this.
- GAP is valuated reasonably with a Price/Forward Earnings ratio of 10.50.
- GAP's Price/Forward Earnings ratio is a bit cheaper when compared to the industry. GAP is cheaper than 77.87% of the companies in the same industry.
- The average S&P500 Price/Forward Earnings ratio is at 22.21. GAP is valued rather cheaply when compared to this.
- 86.89% of the companies in the same industry are more expensive than GAP, based on the Enterprise Value to EBITDA ratio.
- Based on the Price/Free Cash Flow ratio, GAP is valued cheaper than 93.44% of the companies in the same industry.
- The low PEG Ratio(NY), which compensates the Price/Earnings for growth, indicates a rather cheap valuation of the company.
- A more expensive valuation may be justified as GAP's earnings are expected to grow with 15.47% in the coming years.
Profitability Examination for NYSE:GAP
ChartMill assigns a proprietary Profitability Rating to each stock. The score is computed by evaluating various profitability ratios and margins and ranges from 0 to 10. NYSE:GAP was assigned a score of 5 for profitability:
- The Return On Assets of GAP (6.22%) is better than 72.13% of its industry peers.
- Looking at the Return On Equity, with a value of 25.05%, GAP is in the better half of the industry, outperforming 78.69% of the companies in the same industry.
- GAP has a better Return On Invested Capital (9.33%) than 73.77% of its industry peers.
- The Profit Margin of GAP (4.52%) is better than 73.77% of its industry peers.
- Looking at the Operating Margin, with a value of 5.58%, GAP is in the better half of the industry, outperforming 69.67% of the companies in the same industry.
Health Insights: NYSE:GAP
A critical element of ChartMill's stock evaluation is the Health Rating, which spans from 0 to 10. This rating considers multiple health factors, including liquidity and solvency, both in absolute terms and relative to industry peers. NYSE:GAP has received a 5 out of 10:
- GAP has a debt to FCF ratio of 1.29. This is a very positive value and a sign of high solvency as it would only need 1.29 years to pay back of all of its debts.
- GAP has a Debt to FCF ratio of 1.29. This is in the better half of the industry: GAP outperforms 77.05% of its industry peers.
- Although GAP does not score too well on debt/equity it has very limited outstanding debt, which is well covered by the FCF. We will not put too much weight on the debt/equity number as it may be because of low equity, which could be a consequence of a share buyback program for instance. This needs to be investigated.
- Looking at the Quick ratio, with a value of 0.80, GAP is in the better half of the industry, outperforming 67.21% of the companies in the same industry.
Analyzing Growth Metrics
To evaluate a stock's growth potential, ChartMill utilizes a Growth Rating on a scale of 0 to 10. This comprehensive assessment considers various growth aspects, including historical and estimated EPS and revenue growth. NYSE:GAP has achieved a 4 out of 10:
- GAP shows a strong growth in Earnings Per Share. In the last year, the EPS has been growing by 1116.67%, which is quite impressive.
- GAP is expected to show quite a strong growth in Earnings Per Share. In the coming years, the EPS will grow by 14.94% yearly.
- The EPS growth rate is accelerating: in the next years the growth will be better than in the last years.
- When comparing the Revenue growth rate of the last years to the growth rate of the upcoming years, we see that the growth is accelerating.
Our Decent Value screener lists more Decent Value stocks and is updated daily.
Our latest full fundamental report of GAP contains the most current fundamental analsysis.
Keep in mind
This article should in no way be interpreted as advice. The article is based on the observed metrics at the time of writing, but you should always make your own analysis and trade or invest at your own responsibility.