
Unlocking the high Growth Potential of NYSE:FTI.
By Mill Chart
Last update: Oct 15, 2024
Our stock screener has identified TECHNIPFMC PLC (NYSE:FTI) as a potential breakout candidate. This technical breakout setup pattern occurs when the stock consolidates after a strong uptrend. While the actual breakout is uncertain, it may be worth keeping an eye on NYSE:FTI.
Insights from Technical Analysis
ChartMill assigns a Technical Rating to every stock. This score, ranging from 0 to 10, is updated daily and is determined by evaluating multiple technical indicators and properties.
Overall FTI gets a technical rating of 7 out of 10. This is due to a decent performance in both the short and medium term time frames. Compared to the overall market, FTI is only an average performer.
- Both the short term and long term trends are positive. This is a very positive sign.
- FTI is one of the better performing stocks in the Energy Equipment & Services industry, it outperforms 81% of 59 stocks in the same industry.
- FTI is currently trading in the upper part of its 52 week range. The S&P500 Index however is currently trading near a new high, so FTI is lagging the market slightly.
- In the last month FTI has a been trading in the 24.98 - 27.99 range, which is quite wide. It is currently trading near the high of this range.
- When comparing the performance of all stocks over the past year, FTI turns out to be only a medium performer in the overall market: it outperformed 57% of all stocks.
Our latest full technical report of FTI contains the most current technical analsysis.
Looking at the Setup
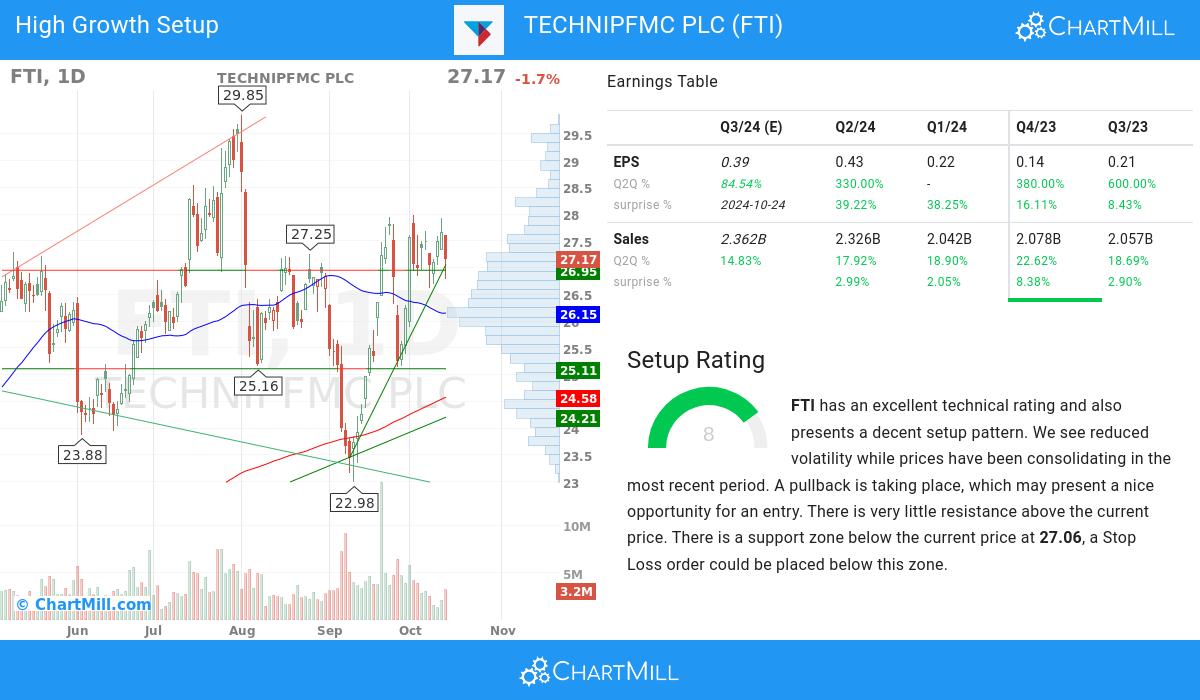
Besides the Technical Rating, ChartMill assigns a Setup Rating to every stock to determine the degree of consolidation. This rating, ranging from 0 to 10, is updated daily and evaluates various short-term technical indicators. NYSE:FTI currently holds a 8 as its setup rating, suggesting a particular level of consolidation in the stock.
Besides having an excellent technical rating, FTI also presents a decent setup pattern. We see reduced volatility while prices have been consolidating in the most recent period. A pullback is taking place, which may present a nice opportunity for an entry. There is very little resistance above the current price. There is a support zone below the current price at 27.06, a Stop Loss order could be placed below this zone.
Some of the high growth metrics of NYSE:FTI highlighted
- TECHNIPFMC PLC has demonstrated consistent growth in its earnings per share (EPS) from one quarter to another (Q2Q), with a 330.0% increase. This indicates improving financial performance and the company's effective management of its operations.
- Over the past 3 years, TECHNIPFMC PLC has demonstrated 33.3% growth in EPS, signifying its positive financial trajectory and potential for future profitability.
- The average next Quarter EPS Estimate for TECHNIPFMC PLC has experienced a 5.08% change in the last 3 months, reflecting evolving expectations by analysts regarding the company's EPS performance.
- The recent financial report of TECHNIPFMC PLC demonstrates a 330.0% increase in quarterly earnings compared to the previous quarter. This growth indicates positive momentum in the company's financials and suggests a promising upward trend
- With positive growth in its operating margin over the past year, TECHNIPFMC PLC showcases its ability to improve profitability through effective cost control and operational efficiency. This growth underscores the company's commitment to enhancing its financial performance.
- With a favorable trend in its free cash flow (FCF) over the past year, TECHNIPFMC PLC demonstrates its ability to generate robust cash flows and maintain financial stability. This growth reflects the company's focus on efficient capital allocation and cash management.
- With a favorable Return on Equity (ROE) of 16.37%, TECHNIPFMC PLC demonstrates its ability to deliver attractive returns for shareholders. This metric highlights the company's effective management of assets and its profitability.
- TECHNIPFMC PLC exhibits a favorable Debt-to-Equity ratio at 0.23. This highlights the company's ability to limit excessive debt levels and maintain a strong equity base, demonstrating its financial stability and risk management practices.
- With a track record of beating EPS estimates in the last 4 quarters, TECHNIPFMC PLC showcases its consistent ability to deliver earnings surprises. This reflects the company's strong execution and its competitive position in the market.
More ideas for high growth momentum breakouts can be found on ChartMill in our High Growth Momentum Breakout screen.
Disclaimer
This article should in no way be interpreted as advice. The article is based on the observed metrics at the time of writing, but you should always make your own analysis and trade or invest at your own responsibility.
46.32
-0.1 (-0.22%)
Find more stocks in the Stock Screener
FTI Latest News and Analysis

