Don't overlook NYSE:FN—a stock with solid growth prospects and a reasonable valuation.
By Mill Chart
Last update: Feb 26, 2025
Take a closer look at FABRINET (NYSE:FN), an affordable growth stock uncovered by our stock screener. NYSE:FN boasts strong growth prospects and excels in financial health indicators, all while maintaining a reasonable valuation. Let's break it down further.
Growth Analysis for NYSE:FN
Every stock receives a Growth Rating from ChartMill, ranging from 0 to 10. This rating assesses various growth aspects, including historical and projected EPS and revenue growth. NYSE:FN boasts a 7 out of 10:
- FN shows a strong growth in Earnings Per Share. In the last year, the EPS has been growing by 24.37%, which is quite impressive.
- The Earnings Per Share has been growing by 18.44% on average over the past years. This is quite good.
- Looking at the last year, FN shows a quite strong growth in Revenue. The Revenue has grown by 14.83% in the last year.
- FN shows quite a strong growth in Revenue. Measured over the last years, the Revenue has been growing by 12.72% yearly.
- Based on estimates for the next years, FN will show a quite strong growth in Earnings Per Share. The EPS will grow by 17.01% on average per year.
- Based on estimates for the next years, FN will show a quite strong growth in Revenue. The Revenue will grow by 15.80% on average per year.
- The Revenue growth rate is accelerating: in the next years the growth will be better than in the last years.
Deciphering NYSE:FN's Valuation Rating
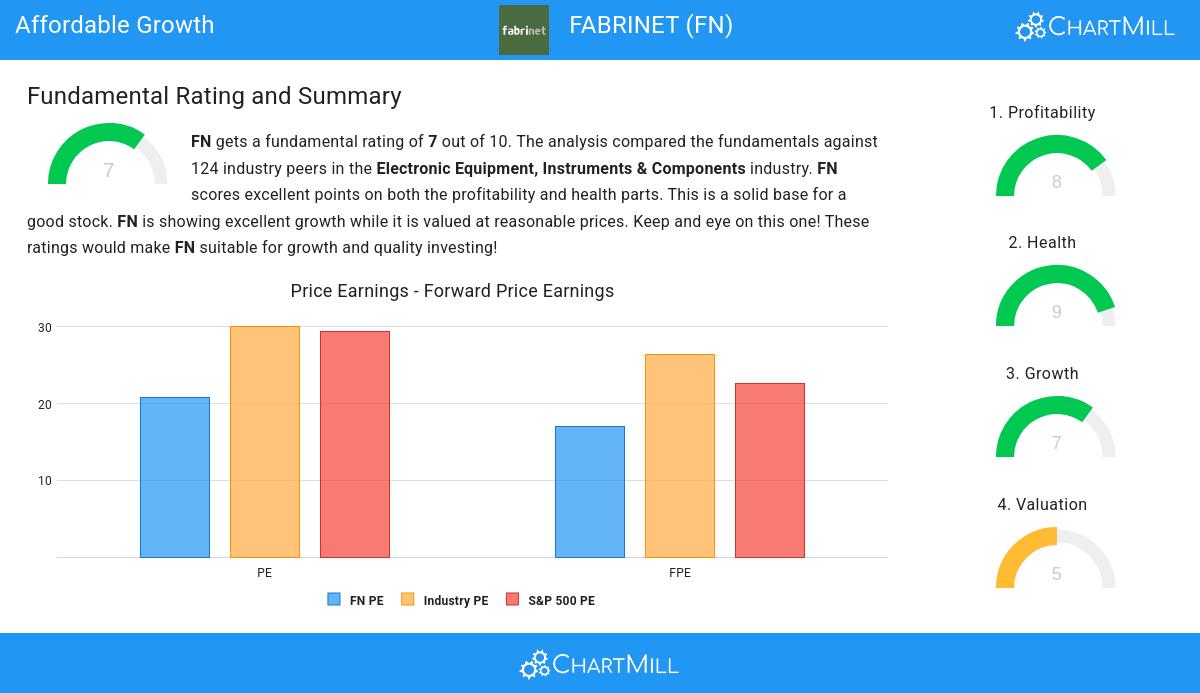
To assess a stock's valuation, ChartMill utilizes a Valuation Rating on a scale of 0 to 10. This comprehensive assessment considers various valuation aspects, comparing price to earnings and cash flows, while factoring in profitability and growth. NYSE:FN has achieved a 5 out of 10:
- Compared to the rest of the industry, the Price/Earnings ratio of FN indicates a somewhat cheap valuation: FN is cheaper than 72.50% of the companies listed in the same industry.
- The average S&P500 Price/Earnings ratio is at 29.43. FN is valued slightly cheaper when compared to this.
- 75.83% of the companies in the same industry are more expensive than FN, based on the Price/Forward Earnings ratio.
- When comparing the Price/Forward Earnings ratio of FN to the average of the S&P500 Index (22.65), we can say FN is valued slightly cheaper.
- FN's Price/Free Cash Flow ratio is a bit cheaper when compared to the industry. FN is cheaper than 70.00% of the companies in the same industry.
- The excellent profitability rating of FN may justify a higher PE ratio.
- A more expensive valuation may be justified as FN's earnings are expected to grow with 17.01% in the coming years.
Assessing Health Metrics for NYSE:FN
ChartMill employs a unique Health Rating system for all stocks. This rating, ranging from 0 to 10, is determined by analyzing various liquidity and solvency ratios. For NYSE:FN, the assigned 9 for health provides valuable insights:
- FN has an Altman-Z score of 9.71. This indicates that FN is financially healthy and has little risk of bankruptcy at the moment.
- FN has a Altman-Z score of 9.71. This is amongst the best in the industry. FN outperforms 89.17% of its industry peers.
- FN has no outstanding debt. Therefor its Debt/Equity and Debt/FCF ratios are 0 and belong to the best of the industry.
- FN has a Current Ratio of 3.32. This indicates that FN is financially healthy and has no problem in meeting its short term obligations.
- The Current ratio of FN (3.32) is better than 66.67% of its industry peers.
- A Quick Ratio of 2.58 indicates that FN has no problem at all paying its short term obligations.
- FN has a Quick ratio of 2.58. This is in the better half of the industry: FN outperforms 66.67% of its industry peers.
Profitability Examination for NYSE:FN
ChartMill assigns a Profitability Rating to every stock. This score ranges from 0 to 10 and evaluates the different profitability ratios and margins, both absolutely, but also relative to the industry peers. NYSE:FN scores a 8 out of 10:
- The Return On Assets of FN (12.82%) is better than 94.17% of its industry peers.
- FN has a Return On Equity of 17.69%. This is amongst the best in the industry. FN outperforms 88.33% of its industry peers.
- FN has a Return On Invested Capital of 12.67%. This is amongst the best in the industry. FN outperforms 88.33% of its industry peers.
- Measured over the past 3 years, the Average Return On Invested Capital for FN is above the industry average of 8.73%.
- Looking at the Profit Margin, with a value of 10.44%, FN belongs to the top of the industry, outperforming 82.50% of the companies in the same industry.
- FN's Profit Margin has improved in the last couple of years.
- FN has a better Operating Margin (9.65%) than 80.00% of its industry peers.
- FN's Operating Margin has improved in the last couple of years.
- FN's Gross Margin has improved in the last couple of years.
Every day, new Affordable Growth stocks can be found on ChartMill in our Affordable Growth screener.
Check the latest full fundamental report of FN for a complete fundamental analysis.
Disclaimer
Important Note: The content of this article is not intended as trading advice. It is essential to perform your own analysis and exercise caution when making trading decisions. The article presents observations created by automated analysis but does not guarantee any trading or investment outcomes. Always trade responsibly and make independent judgments.
183.66
-3.04 (-1.63%)
Find more stocks in the Stock Screener
FN Latest News and Analysis
 2 days ago - ChartmillFABRINET (NYSE:FN), a growth stock which is not overvalued.
Uncover the potential of FABRINET, a growth stock reasonably priced. NYSE:FN is excelling in growth aspects, maintaining a healthy financial position, and still offers an attractive valuation.
 11 days ago - ChartmillWhy Peter Lynch may take an interest in FABRINET (NYSE:FN)
Let’s dive into FABRINET (NYSE:FN) using Peter Lynch’s key investing principles, from earnings growth and debt levels to long-term scalability and valuation.
