
Investors should take notice of NASDAQ:FLEX—it offers a great deal for the fundamentals it presents.
By Mill Chart
Last update: Feb 3, 2025
Uncover the potential of FLEX LTD (NASDAQ:FLEX) as our stock screener's choice for an undervalued stock. NASDAQ:FLEX maintains a strong financial position and offers an appealing valuation. We'll delve into the specifics below.
How do we evaluate the Valuation for NASDAQ:FLEX?
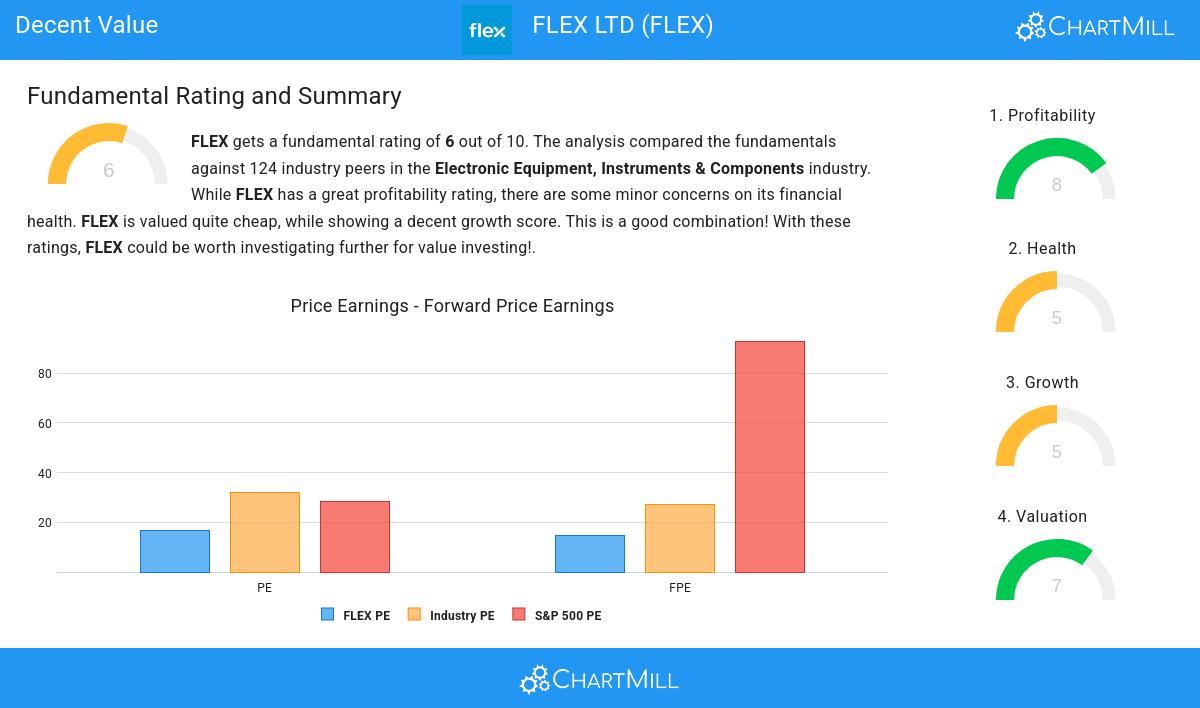
To assess a stock's valuation, ChartMill utilizes a Valuation Rating on a scale of 0 to 10. This comprehensive assessment considers various valuation aspects, comparing price to earnings and cash flows, while factoring in profitability and growth. NASDAQ:FLEX has achieved a 7 out of 10:
- FLEX's Price/Earnings ratio is rather cheap when compared to the industry. FLEX is cheaper than 85.00% of the companies in the same industry.
- FLEX is valuated rather cheaply when we compare the Price/Earnings ratio to 28.46, which is the current average of the S&P500 Index.
- Based on the Price/Forward Earnings ratio, FLEX is valued cheaper than 85.00% of the companies in the same industry.
- Compared to an average S&P500 Price/Forward Earnings ratio of 92.87, FLEX is valued rather cheaply.
- Based on the Enterprise Value to EBITDA ratio, FLEX is valued cheaper than 92.50% of the companies in the same industry.
- FLEX's Price/Free Cash Flow ratio is rather cheap when compared to the industry. FLEX is cheaper than 88.33% of the companies in the same industry.
- FLEX has an outstanding profitability rating, which may justify a higher PE ratio.
Profitability Assessment of NASDAQ:FLEX
ChartMill's Profitability Rating offers a unique perspective on stock analysis, providing scores from 0 to 10. These ratings consider a wide range of profitability metrics and margins, both in comparison to industry peers and on their own merits. For NASDAQ:FLEX, the assigned 8 is a significant indicator of profitability:
- Looking at the Return On Assets, with a value of 9.14%, FLEX belongs to the top of the industry, outperforming 88.33% of the companies in the same industry.
- FLEX has a Return On Equity of 32.47%. This is amongst the best in the industry. FLEX outperforms 95.83% of its industry peers.
- With an excellent Return On Invested Capital value of 17.54%, FLEX belongs to the best of the industry, outperforming 95.83% of the companies in the same industry.
- The 3 year average ROIC (8.78%) for FLEX is below the current ROIC(17.54%), indicating increased profibility in the last year.
- With a decent Profit Margin value of 3.54%, FLEX is doing good in the industry, outperforming 64.17% of the companies in the same industry.
- FLEX's Profit Margin has improved in the last couple of years.
- FLEX has a better Operating Margin (4.25%) than 60.83% of its industry peers.
- In the last couple of years the Operating Margin of FLEX has grown nicely.
- FLEX's Gross Margin has improved in the last couple of years.
Health Examination for NASDAQ:FLEX
ChartMill employs a unique Health Rating system for all stocks. This rating, ranging from 0 to 10, is determined by analyzing various liquidity and solvency ratios. For NASDAQ:FLEX, the assigned 5 for health provides valuable insights:
- FLEX has an Altman-Z score of 4.00. This indicates that FLEX is financially healthy and has little risk of bankruptcy at the moment.
- FLEX has a better Altman-Z score (4.00) than 65.00% of its industry peers.
- The Debt to FCF ratio of FLEX is 2.39, which is a good value as it means it would take FLEX, 2.39 years of fcf income to pay off all of its debts.
- FLEX has a better Debt to FCF ratio (2.39) than 70.83% of its industry peers.
- Although FLEX does not score too well on debt/equity it has very limited outstanding debt, which is well covered by the FCF. We will not put too much weight on the debt/equity number as it may be because of low equity, which could be a consequence of a share buyback program for instance. This needs to be investigated.
Understanding NASDAQ:FLEX's Growth
ChartMill employs its own Growth Rating system for all stocks. This score, ranging from 0 to 10, is derived by evaluating different growth factors, such as EPS and revenue growth, taking into account both past performance and future projections. NASDAQ:FLEX has earned a 5 for growth:
- Measured over the past years, FLEX shows a quite strong growth in Earnings Per Share. The EPS has been growing by 17.29% on average per year.
- The Revenue has grown by 55.95% in the past year. This is a very strong growth!
- Based on estimates for the next years, FLEX will show a quite strong growth in Earnings Per Share. The EPS will grow by 9.87% on average per year.
- When comparing the Revenue growth rate of the last years to the growth rate of the upcoming years, we see that the growth is accelerating.
Our Decent Value screener lists more Decent Value stocks and is updated daily.
Our latest full fundamental report of FLEX contains the most current fundamental analsysis.
Disclaimer
Important Note: The content of this article is not intended as trading advice. It is essential to perform your own analysis and exercise caution when making trading decisions. The article presents observations created by automated analysis but does not guarantee any trading or investment outcomes. Always trade responsibly and make independent judgments.
NASDAQ:FLEX (4/29/2025, 12:23:07 PM)
35.2
+0.11 (+0.31%)
Find more stocks in the Stock Screener
FLEX Latest News and Analysis
 12 days ago - ChartmillChecking the Peter Lynch growth stock criteria for FLEX LTD (NASDAQ:FLEX)
Peter Lynch favored companies with strong earnings growth, reasonable valuations, and solid financials. In this analysis, we’ll determine if FLEX LTD (NASDAQ:FLEX) qualifies as a true Lynch-style investment.
