
Discover FLEX LTD (NASDAQ:FLEX), an undervalued stock highlighted by our stock screener. NASDAQ:FLEX showcases solid financial health and profitability while maintaining an appealing valuation. We'll explore the details.
How We Gauge Valuation for NASDAQ:FLEX
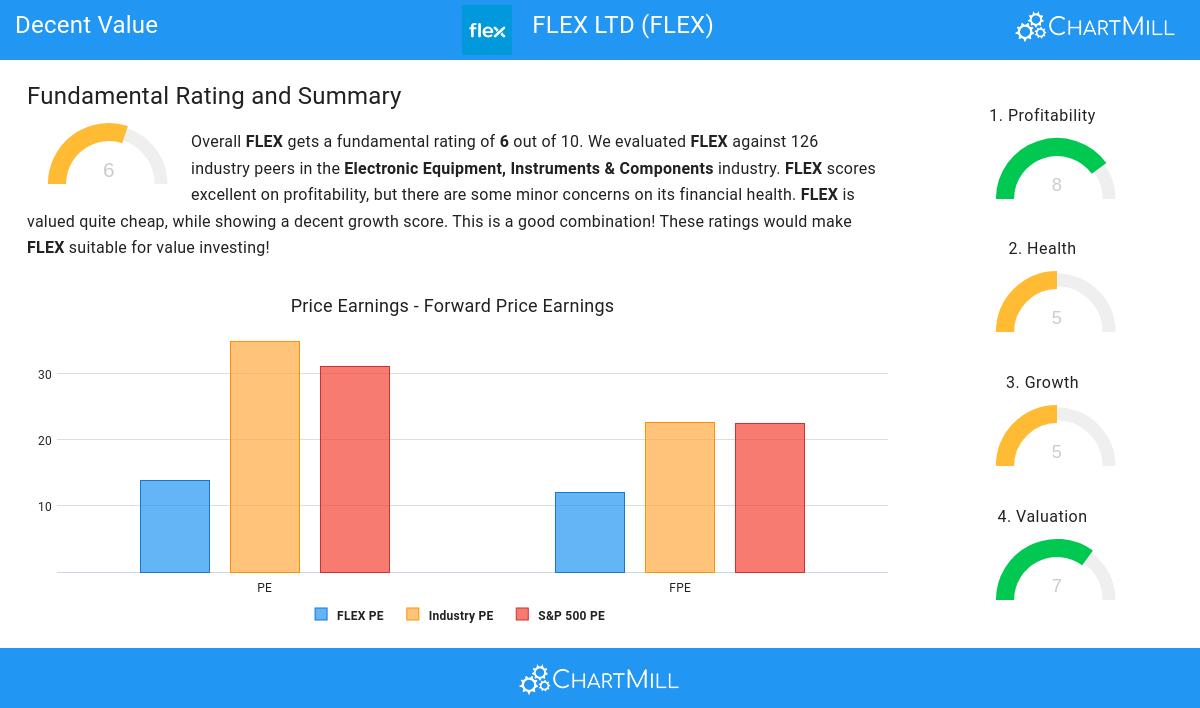
ChartMill provides a Valuation Rating to every stock, ranging from 0 to 10. This rating assesses various valuation aspects, comparing price to earnings and cash flows, while considering factors like profitability and growth. NASDAQ:FLEX boasts a 7 out of 10:
- FLEX's Price/Earnings ratio is rather cheap when compared to the industry. FLEX is cheaper than 86.40% of the companies in the same industry.
- FLEX is valuated cheaply when we compare the Price/Earnings ratio to 31.10, which is the current average of the S&P500 Index.
- Based on the Price/Forward Earnings ratio, FLEX is valued cheaply inside the industry as 88.00% of the companies are valued more expensively.
- FLEX is valuated rather cheaply when we compare the Price/Forward Earnings ratio to 22.54, which is the current average of the S&P500 Index.
- Based on the Enterprise Value to EBITDA ratio, FLEX is valued cheaper than 93.60% of the companies in the same industry.
- Based on the Price/Free Cash Flow ratio, FLEX is valued cheaper than 90.40% of the companies in the same industry.
- The excellent profitability rating of FLEX may justify a higher PE ratio.
What does the Profitability looks like for NASDAQ:FLEX
ChartMill employs its own Profitability Rating system for stock evaluation. This score, ranging from 0 to 10, is derived from an analysis of diverse profitability metrics and margins. In the case of NASDAQ:FLEX, the assigned 8 is noteworthy for profitability:
- With an excellent Return On Assets value of 8.85%, FLEX belongs to the best of the industry, outperforming 89.60% of the companies in the same industry.
- With an excellent Return On Equity value of 31.43%, FLEX belongs to the best of the industry, outperforming 96.80% of the companies in the same industry.
- FLEX has a better Return On Invested Capital (18.80%) than 98.40% of its industry peers.
- The 3 year average ROIC (8.78%) for FLEX is below the current ROIC(18.80%), indicating increased profibility in the last year.
- With a decent Profit Margin value of 3.32%, FLEX is doing good in the industry, outperforming 63.20% of the companies in the same industry.
- FLEX's Profit Margin has improved in the last couple of years.
- FLEX has a better Operating Margin (4.41%) than 60.80% of its industry peers.
- FLEX's Operating Margin has improved in the last couple of years.
- In the last couple of years the Gross Margin of FLEX has grown nicely.
Understanding NASDAQ:FLEX's Health Score
ChartMill utilizes a Health Rating to assess stocks, scoring them on a scale of 0 to 10. This rating takes into account a variety of liquidity and solvency ratios, both in absolute terms and in comparison to industry peers. NASDAQ:FLEX has earned a 5 out of 10:
- An Altman-Z score of 3.98 indicates that FLEX is not in any danger for bankruptcy at the moment.
- Looking at the Altman-Z score, with a value of 3.98, FLEX is in the better half of the industry, outperforming 69.60% of the companies in the same industry.
- The Debt to FCF ratio of FLEX is 2.71, which is a good value as it means it would take FLEX, 2.71 years of fcf income to pay off all of its debts.
- The Debt to FCF ratio of FLEX (2.71) is better than 68.80% of its industry peers.
What does the Growth looks like for NASDAQ:FLEX
Every stock receives a Growth Rating from ChartMill, ranging from 0 to 10. This rating assesses various growth aspects, including historical and projected EPS and revenue growth. NASDAQ:FLEX boasts a 5 out of 10:
- Measured over the past years, FLEX shows a quite strong growth in Earnings Per Share. The EPS has been growing by 17.29% on average per year.
- Looking at the last year, FLEX shows a very strong growth in Revenue. The Revenue has grown by 55.94%.
- Based on estimates for the next years, FLEX will show a quite strong growth in Earnings Per Share. The EPS will grow by 9.43% on average per year.
- The Revenue growth rate is accelerating: in the next years the growth will be better than in the last years.
More Decent Value stocks can be found in our Decent Value screener.
For an up to date full fundamental analysis you can check the fundamental report of FLEX
Disclaimer
This is not investing advice! The article highlights some of the observations at the time of writing, but you should always make your own analysis and invest based on your own insights.
