
For those who appreciate value investing, NASDAQ:FLEX is a compelling option with its solid fundamentals.
By Mill Chart
Last update: Sep 30, 2024
Take a closer look at FLEX LTD (NASDAQ:FLEX), a remarkable value stock uncovered by our stock screener. NASDAQ:FLEX excels in fundamentals and maintains a very reasonable valuation. Let's break it down further.
Unpacking NASDAQ:FLEX's Valuation Rating
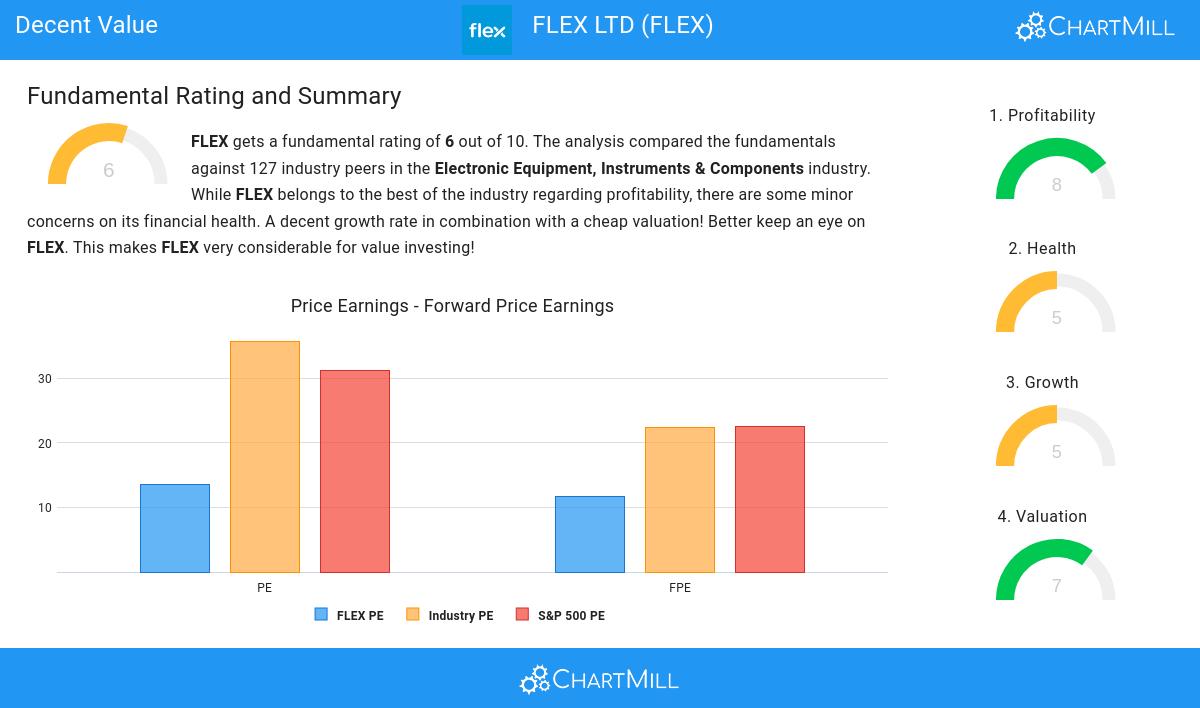
ChartMill assigns a proprietary Valuation Rating to each stock. The score is computed by evaluating various valuation aspects, like price to earnings and free cash flow, both absolutely as relative to the market and industry. NASDAQ:FLEX was assigned a score of 7 for valuation:
- Based on the Price/Earnings ratio, FLEX is valued cheaply inside the industry as 87.30% of the companies are valued more expensively.
- FLEX's Price/Earnings ratio indicates a rather cheap valuation when compared to the S&P500 average which is at 31.19.
- A Price/Forward Earnings ratio of 11.76 indicates a reasonable valuation of FLEX.
- Based on the Price/Forward Earnings ratio, FLEX is valued cheaply inside the industry as 89.68% of the companies are valued more expensively.
- The average S&P500 Price/Forward Earnings ratio is at 22.50. FLEX is valued slightly cheaper when compared to this.
- FLEX's Enterprise Value to EBITDA ratio is rather cheap when compared to the industry. FLEX is cheaper than 96.83% of the companies in the same industry.
- Based on the Price/Free Cash Flow ratio, FLEX is valued cheaper than 90.48% of the companies in the same industry.
- FLEX has an outstanding profitability rating, which may justify a higher PE ratio.
What does the Profitability looks like for NASDAQ:FLEX
ChartMill assigns a proprietary Profitability Rating to each stock. The score is computed by evaluating various profitability ratios and margins and ranges from 0 to 10. NASDAQ:FLEX was assigned a score of 8 for profitability:
- Looking at the Return On Assets, with a value of 8.85%, FLEX belongs to the top of the industry, outperforming 89.68% of the companies in the same industry.
- FLEX has a Return On Equity of 31.43%. This is amongst the best in the industry. FLEX outperforms 96.83% of its industry peers.
- The Return On Invested Capital of FLEX (18.80%) is better than 98.41% of its industry peers.
- The last Return On Invested Capital (18.80%) for FLEX is above the 3 year average (8.78%), which is a sign of increasing profitability.
- FLEX's Profit Margin of 3.32% is fine compared to the rest of the industry. FLEX outperforms 63.49% of its industry peers.
- In the last couple of years the Profit Margin of FLEX has grown nicely.
- With a decent Operating Margin value of 4.41%, FLEX is doing good in the industry, outperforming 61.11% of the companies in the same industry.
- FLEX's Operating Margin has improved in the last couple of years.
- FLEX's Gross Margin has improved in the last couple of years.
Deciphering NASDAQ:FLEX's Health Rating
ChartMill assigns a Health Rating to every stock. This score ranges from 0 to 10 and evaluates the different health aspects like liquidity and solvency, both absolutely, but also relative to the industry peers. NASDAQ:FLEX scores a 5 out of 10:
- An Altman-Z score of 3.97 indicates that FLEX is not in any danger for bankruptcy at the moment.
- Looking at the Altman-Z score, with a value of 3.97, FLEX is in the better half of the industry, outperforming 69.05% of the companies in the same industry.
- FLEX has a debt to FCF ratio of 2.71. This is a good value and a sign of high solvency as FLEX would need 2.71 years to pay back of all of its debts.
- Looking at the Debt to FCF ratio, with a value of 2.71, FLEX is in the better half of the industry, outperforming 69.05% of the companies in the same industry.
Growth Assessment of NASDAQ:FLEX
ChartMill assigns a Growth Rating to every stock. This score ranges from 0 to 10 and evaluates the different growth aspects like EPS and Revenue, both in the past as in the future. NASDAQ:FLEX scores a 5 out of 10:
- FLEX shows quite a strong growth in Earnings Per Share. Measured over the last years, the EPS has been growing by 17.29% yearly.
- Looking at the last year, FLEX shows a very strong growth in Revenue. The Revenue has grown by 55.94%.
- Based on estimates for the next years, FLEX will show a quite strong growth in Earnings Per Share. The EPS will grow by 9.43% on average per year.
- The Revenue growth rate is accelerating: in the next years the growth will be better than in the last years.
Every day, new Decent Value stocks can be found on ChartMill in our Decent Value screener.
Check the latest full fundamental report of FLEX for a complete fundamental analysis.
Keep in mind
This is not investing advice! The article highlights some of the observations at the time of writing, but you should always make your own analysis and invest based on your own insights.
31.54
+0.61 (+1.97%)
Find more stocks in the Stock Screener
FLEX Latest News and Analysis
 a day ago - ChartmillChecking the Peter Lynch growth stock criteria for FLEX LTD (NASDAQ:FLEX)
Peter Lynch favored companies with strong earnings growth, reasonable valuations, and solid financials. In this analysis, we’ll determine if FLEX LTD (NASDAQ:FLEX) qualifies as a true Lynch-style investment.
