
FIFTH THIRD BANCORP is setting up nicely for a breakout.
By Mill Chart
Last update: Oct 10, 2024
Our stock screener has identified FIFTH THIRD BANCORP (NASDAQ:FITB) as a potential breakout candidate. This technical breakout setup pattern occurs when the stock consolidates after a strong uptrend. While the actual breakout is uncertain, it may be worth keeping an eye on NASDAQ:FITB.
Deciphering the Technical Picture of NASDAQ:FITB
As part of its analysis, ChartMill provides a comprehensive Technical Rating for each stock. This rating, ranging from 0 to 10, is updated on a daily basis and is based on the evaluation of various technical indicators and properties.
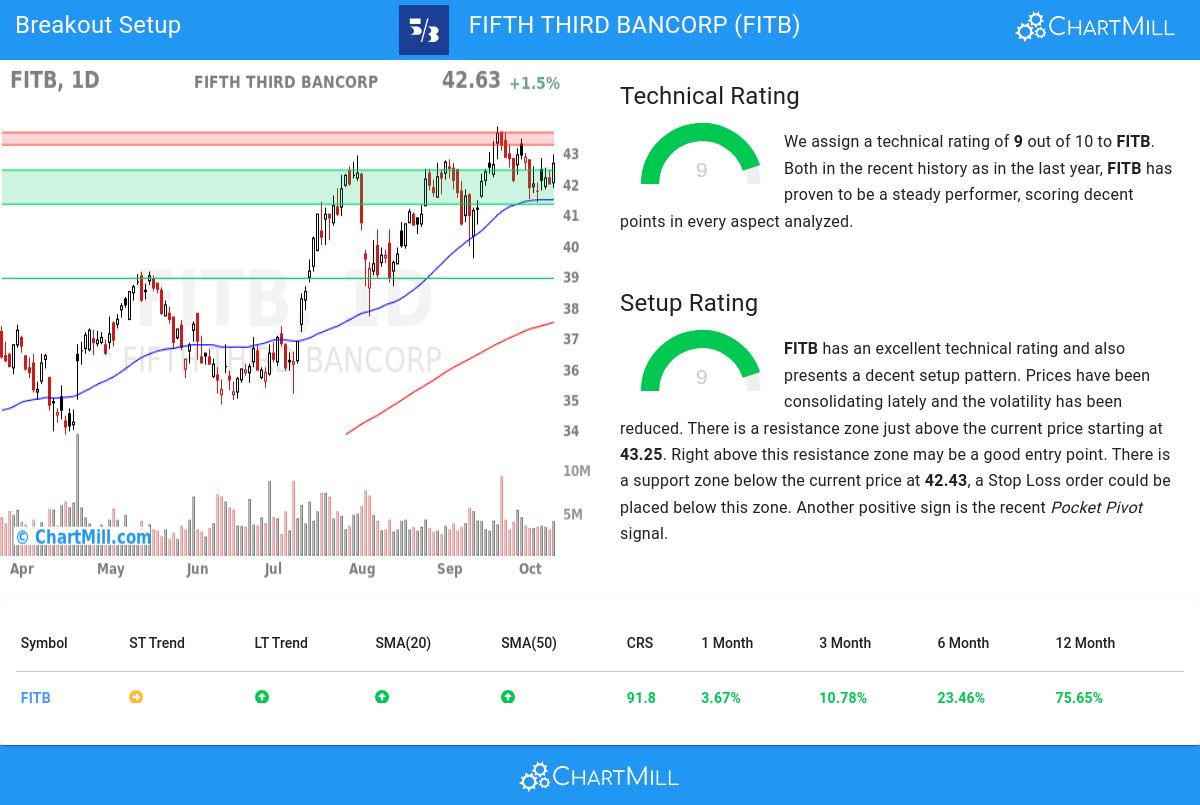
Taking everything into account, FITB scores 9 out of 10 in our technical rating. This is due to a consistent performance in both the short and longer term time frames. Also compared to the overall market, FITB is showing a nice and steady performance.
- The long term trend is positive and the short term trend is neutral. The long term trend may just continue or reversal may be around the corner!
- When comparing the yearly performance of all stocks, we notice that FITB is one of the better performing stocks in the market, outperforming 91% of all stocks. On top of that, FITB also shows a nice and consistent pattern of rising prices.
- FITB is part of the Banks industry. There are 406 other stocks in this industry. FITB outperforms 93% of them.
- FITB is currently trading near its 52 week high, which is a good sign. The S&P500 Index however is also trading near new highs, which makes the performance in line with the market.
- In the last month FITB has a been trading in the 40.66 - 43.84 range, which is quite wide. It is currently trading in the middle of this range where prices have been consolidating recently, this may present a good entry opportunity, but some resistance may be present above.
Our latest full technical report of FITB contains the most current technical analsysis.
How does the Setup look for NASDAQ:FITB
Next to the Technical Rating, the Setup Rating of a stock determines to which extend the stock is consolidating. This score also ranges from 0 to 10 and is updated daily. The setup score evaluates various short term technical indicators. For NASDAQ:FITB this score is currently 9:
FITB has an excellent technical rating and also presents a decent setup pattern. Prices have been consolidating lately and the volatility has been reduced. There is a resistance zone just above the current price starting at 43.25. Right above this resistance zone may be a good entry point. There is a support zone below the current price at 42.43, a Stop Loss order could be placed below this zone. Very recently a Pocket Pivot signal was observed. This is another positive sign.
How can NASDAQ:FITB be traded?
One strategy to consider is waiting for the actual breakout to occur, where the stock breaks out above the current consolidation zone. Traders can then enter a buy position, anticipating further upward momentum. As a risk management measure, it is advisable to set a stop loss order below the consolidation zone.
Disclaimer: This article is not intended to provide trading advice. It is crucial to conduct your own analysis and consider your own observations and trading style when making investment decisions. The article solely presents technical observations and should not be relied upon as a sole basis for trading.
Every day, new breakout setups can be found on ChartMill in our Breakout screener.
Disclaimer
This article should in no way be interpreted as advice. The article is based on the observed metrics at the time of writing, but you should always make your own analysis and trade or invest at your own responsibility.