
FIFTH THIRD BANCORP (NASDAQ:FITB) showing some interesting technicals. Here's why.
By Mill Chart
Last update: Sep 16, 2024
Our stock screener has flagged FIFTH THIRD BANCORP (NASDAQ:FITB) as a potential breakout candidate. This occurs when the stock shows signs of consolidation after a notable upward trend. While we can't predict the actual breakout, it's worth monitoring NASDAQ:FITB for potential movement.
Deciphering the Technical Picture of NASDAQ:FITB
Every day, ChartMill assigns a Technical Rating to each stock, providing a score ranging from 0 to 10. This rating is determined by evaluating various technical indicators and properties.
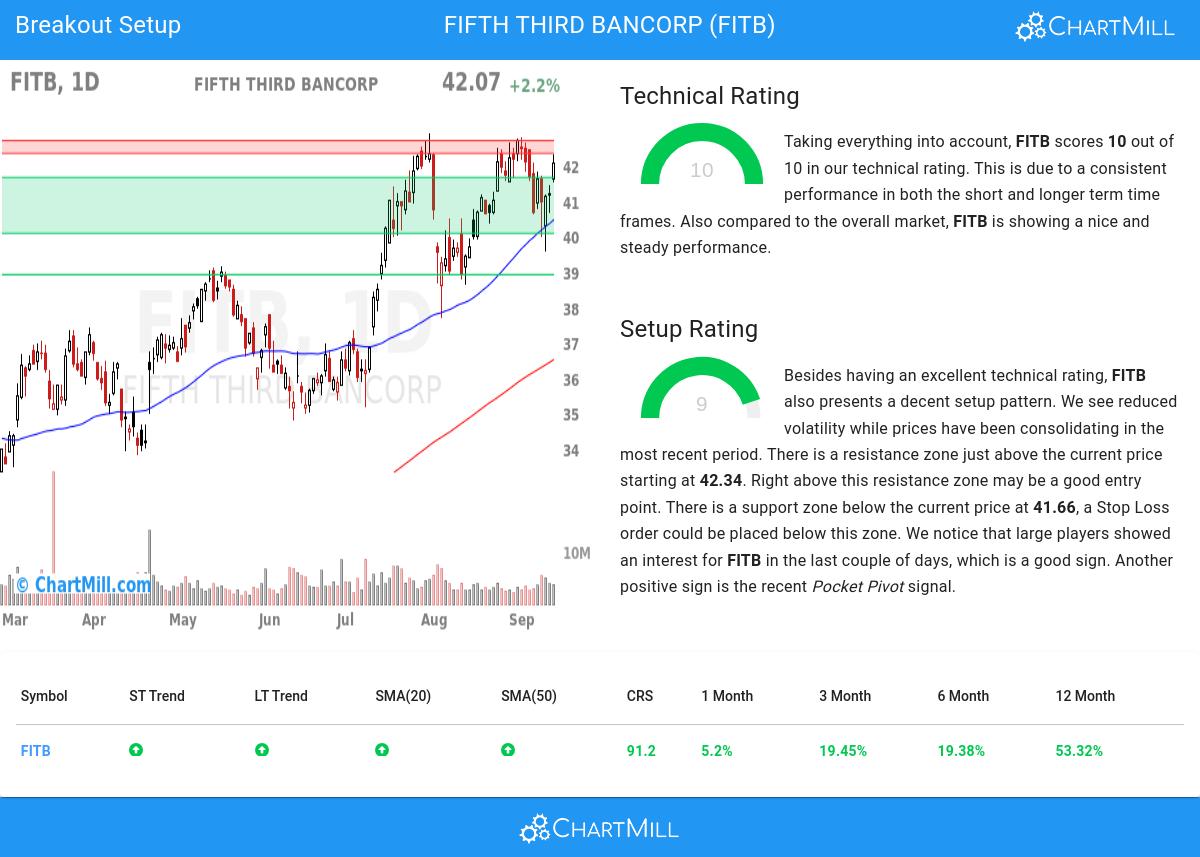
Overall FITB gets a technical rating of 10 out of 10. This is due to a consistent performance in both the short and longer term time frames. Also compared to the overall market, FITB is showing a nice and steady performance.
- The long and short term trends are both positive. This is looking good!
- When comparing the yearly performance of all stocks, we notice that FITB is one of the better performing stocks in the market, outperforming 91% of all stocks. On top of that, FITB also shows a nice and consistent pattern of rising prices.
- FITB is part of the Banks industry. There are 402 other stocks in this industry. FITB outperforms 83% of them.
- FITB is currently trading near its 52 week high, which is a good sign. The S&P500 Index however is also trading near new highs, which makes the performance in line with the market.
- In the last month FITB has a been trading in the 39.56 - 42.78 range, which is quite wide. It is currently trading near the high of this range.
- Prices have been consolidating recently, this may present a good entry opportunity.
Our latest full technical report of FITB contains the most current technical analsysis.
Why is NASDAQ:FITB a setup?
Next to the Technical Rating, the Setup Rating of a stock determines to which extend the stock is consolidating. This score also ranges from 0 to 10 and is updated daily. The setup score evaluates various short term technical indicators. For NASDAQ:FITB this score is currently 9:
FITB has an excellent technical rating and also presents a decent setup pattern. We see reduced volatility while prices have been consolidating in the most recent period. There is a resistance zone just above the current price starting at 42.34. Right above this resistance zone may be a good entry point. There is a support zone below the current price at 41.66, a Stop Loss order could be placed below this zone. We notice that large players showed an interest for FITB in the last couple of days, which is a good sign. Very recently a Pocket Pivot signal was observed. This is another positive sign.
How to trade NASDAQ:FITB?
For a potential trade one would typically wait until the stock breaks out of the consolidation zone to enter the stock and it could be sold again for a loss when it would fall back below the zone.
Please note that this article should not be construed as trading advice. The information provided is solely based on automated technical analysis and serves to highlight technical observations. It is important to conduct your own analysis and make trading decisions based on your own judgment and responsibility.
More breakout setups can be found in our Breakout screener.
Keep in mind
This is not investing advice! The article highlights some of the observations at the time of writing, but you should always make your own analysis and invest based on your own insights.