
NASDAQ:EXEL: good value for what you're paying.
By Mill Chart
Last update: Feb 4, 2025
Discover EXELIXIS INC (NASDAQ:EXEL), an undervalued stock highlighted by our stock screener. NASDAQ:EXEL showcases solid financial health and profitability while maintaining an appealing valuation. We'll explore the details.
How We Gauge Valuation for NASDAQ:EXEL
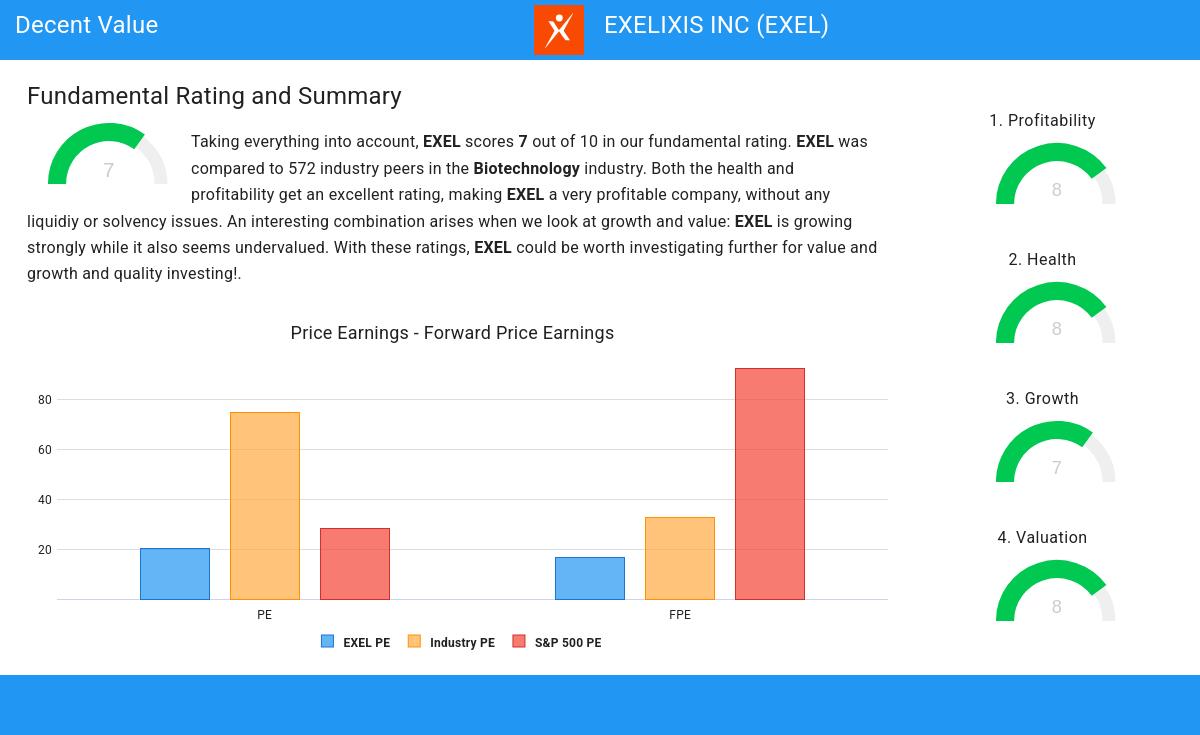
ChartMill provides a Valuation Rating to every stock, ranging from 0 to 10. This rating assesses various valuation aspects, comparing price to earnings and cash flows, while considering factors like profitability and growth. NASDAQ:EXEL boasts a 8 out of 10:
- 95.58% of the companies in the same industry are more expensive than EXEL, based on the Price/Earnings ratio.
- Compared to an average S&P500 Price/Earnings ratio of 28.36, EXEL is valued a bit cheaper.
- Based on the Price/Forward Earnings ratio, EXEL is valued cheaply inside the industry as 95.58% of the companies are valued more expensively.
- EXEL's Price/Forward Earnings ratio indicates a rather cheap valuation when compared to the S&P500 average which is at 92.49.
- Based on the Enterprise Value to EBITDA ratio, EXEL is valued cheaply inside the industry as 96.99% of the companies are valued more expensively.
- Based on the Price/Free Cash Flow ratio, EXEL is valued cheaply inside the industry as 96.28% of the companies are valued more expensively.
- EXEL's low PEG Ratio(NY), which compensates the Price/Earnings for growth, indicates a rather cheap valuation of the company.
- The excellent profitability rating of EXEL may justify a higher PE ratio.
- A more expensive valuation may be justified as EXEL's earnings are expected to grow with 54.51% in the coming years.
Profitability Assessment of NASDAQ:EXEL
ChartMill employs its own Profitability Rating system for stock evaluation. This score, ranging from 0 to 10, is derived from an analysis of diverse profitability metrics and margins. In the case of NASDAQ:EXEL, the assigned 8 is noteworthy for profitability:
- Looking at the Return On Assets, with a value of 15.77%, EXEL belongs to the top of the industry, outperforming 98.05% of the companies in the same industry.
- Looking at the Return On Equity, with a value of 20.52%, EXEL belongs to the top of the industry, outperforming 97.17% of the companies in the same industry.
- With an excellent Return On Invested Capital value of 18.78%, EXEL belongs to the best of the industry, outperforming 97.70% of the companies in the same industry.
- The 3 year average ROIC (7.03%) for EXEL is below the current ROIC(18.78%), indicating increased profibility in the last year.
- Looking at the Profit Margin, with a value of 22.43%, EXEL belongs to the top of the industry, outperforming 97.35% of the companies in the same industry.
- With an excellent Operating Margin value of 29.22%, EXEL belongs to the best of the industry, outperforming 98.41% of the companies in the same industry.
- The Gross Margin of EXEL (96.25%) is better than 96.81% of its industry peers.
Health Assessment of NASDAQ:EXEL
ChartMill employs its own Health Rating for stock assessment. This rating, ranging from 0 to 10, is calculated by examining various liquidity and solvency ratios. In the case of NASDAQ:EXEL, the assigned 8 reflects its health status:
- An Altman-Z score of 10.03 indicates that EXEL is not in any danger for bankruptcy at the moment.
- The Altman-Z score of EXEL (10.03) is better than 86.55% of its industry peers.
- EXEL has no outstanding debt. Therefor its Debt/Equity and Debt/FCF ratios are 0 and belong to the best of the industry.
- EXEL has a Current Ratio of 3.93. This indicates that EXEL is financially healthy and has no problem in meeting its short term obligations.
- A Quick Ratio of 3.88 indicates that EXEL has no problem at all paying its short term obligations.
How We Gauge Growth for NASDAQ:EXEL
ChartMill employs its own Growth Rating system for all stocks. This score, ranging from 0 to 10, is derived by evaluating different growth factors, such as EPS and revenue growth, taking into account both past performance and future projections. NASDAQ:EXEL has earned a 7 for growth:
- EXEL shows a strong growth in Earnings Per Share. In the last year, the EPS has been growing by 485.71%, which is quite impressive.
- EXEL shows quite a strong growth in Revenue. In the last year, the Revenue has grown by 17.31%.
- The Revenue has been growing by 16.47% on average over the past years. This is quite good.
- Based on estimates for the next years, EXEL will show a very strong growth in Earnings Per Share. The EPS will grow by 47.56% on average per year.
- The Revenue is expected to grow by 10.82% on average over the next years. This is quite good.
- The EPS growth rate is accelerating: in the next years the growth will be better than in the last years.
Our Decent Value screener lists more Decent Value stocks and is updated daily.
For an up to date full fundamental analysis you can check the fundamental report of EXEL
Keep in mind
Important Note: The content of this article is not intended as trading advice. It is essential to perform your own analysis and exercise caution when making trading decisions. The article presents observations created by automated analysis but does not guarantee any trading or investment outcomes. Always trade responsibly and make independent judgments.