
In a market where value is scarce, NASDAQ:EXEL offers a refreshing opportunity with its solid fundamentals.
By Mill Chart
Last update: Oct 18, 2024
Consider EXELIXIS INC (NASDAQ:EXEL) as a top value stock, identified by our stock screening tool. NASDAQ:EXEL shines in terms of profitability, solvency, and liquidity, all while remaining very reasonably priced. Let's dive deeper into the analysis.
Understanding NASDAQ:EXEL's Valuation Score
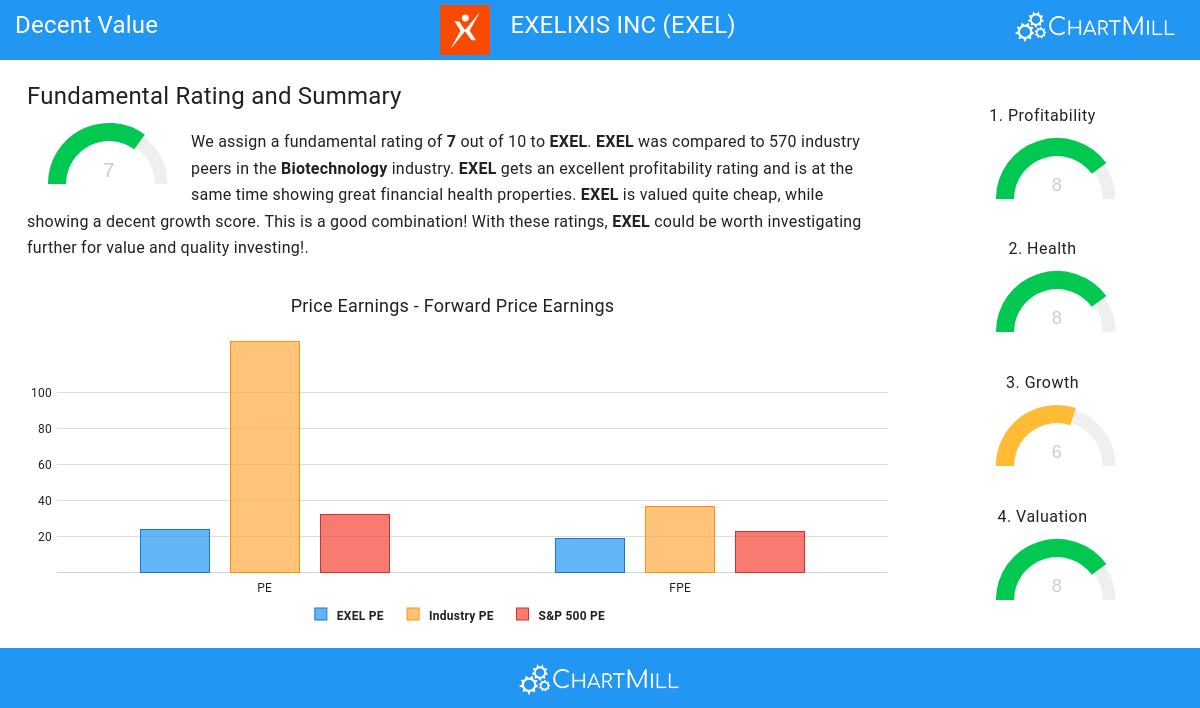
To assess a stock's valuation, ChartMill utilizes a Valuation Rating on a scale of 0 to 10. This comprehensive assessment considers various valuation aspects, comparing price to earnings and cash flows, while factoring in profitability and growth. NASDAQ:EXEL has achieved a 8 out of 10:
- 95.93% of the companies in the same industry are more expensive than EXEL, based on the Price/Earnings ratio.
- When comparing the Price/Earnings ratio of EXEL to the average of the S&P500 Index (31.77), we can say EXEL is valued slightly cheaper.
- Compared to the rest of the industry, the Price/Forward Earnings ratio of EXEL indicates a rather cheap valuation: EXEL is cheaper than 95.22% of the companies listed in the same industry.
- 96.28% of the companies in the same industry are more expensive than EXEL, based on the Enterprise Value to EBITDA ratio.
- Based on the Price/Free Cash Flow ratio, EXEL is valued cheaper than 96.28% of the companies in the same industry.
- EXEL's low PEG Ratio(NY), which compensates the Price/Earnings for growth, indicates a rather cheap valuation of the company.
- The excellent profitability rating of EXEL may justify a higher PE ratio.
- EXEL's earnings are expected to grow with 47.15% in the coming years. This may justify a more expensive valuation.
Profitability Analysis for NASDAQ:EXEL
ChartMill assigns a proprietary Profitability Rating to each stock. The score is computed by evaluating various profitability ratios and margins and ranges from 0 to 10. NASDAQ:EXEL was assigned a score of 8 for profitability:
- With an excellent Return On Assets value of 12.62%, EXEL belongs to the best of the industry, outperforming 97.70% of the companies in the same industry.
- The Return On Equity of EXEL (16.51%) is better than 96.46% of its industry peers.
- EXEL has a better Return On Invested Capital (13.15%) than 96.28% of its industry peers.
- The 3 year average ROIC (7.03%) for EXEL is below the current ROIC(13.15%), indicating increased profibility in the last year.
- EXEL has a Profit Margin of 17.38%. This is amongst the best in the industry. EXEL outperforms 96.81% of its industry peers.
- EXEL has a Operating Margin of 20.00%. This is amongst the best in the industry. EXEL outperforms 96.64% of its industry peers.
- EXEL has a Gross Margin of 96.05%. This is amongst the best in the industry. EXEL outperforms 96.46% of its industry peers.
What does the Health looks like for NASDAQ:EXEL
ChartMill utilizes a Health Rating to assess stocks, scoring them on a scale of 0 to 10. This rating takes into account a variety of liquidity and solvency ratios, both in absolute terms and in comparison to industry peers. NASDAQ:EXEL has earned a 8 out of 10:
- An Altman-Z score of 9.21 indicates that EXEL is not in any danger for bankruptcy at the moment.
- EXEL's Altman-Z score of 9.21 is amongst the best of the industry. EXEL outperforms 83.89% of its industry peers.
- EXEL has no outstanding debt. Therefor its Debt/Equity and Debt/FCF ratios are 0 and belong to the best of the industry.
- A Current Ratio of 4.27 indicates that EXEL has no problem at all paying its short term obligations.
- A Quick Ratio of 4.21 indicates that EXEL has no problem at all paying its short term obligations.
Understanding NASDAQ:EXEL's Growth Score
ChartMill assigns a Growth Rating to every stock. This score ranges from 0 to 10 and evaluates the different growth aspects like EPS and Revenue, both in the past as in the future. NASDAQ:EXEL scores a 6 out of 10:
- EXEL shows a strong growth in Earnings Per Share. In the last year, the EPS has been growing by 143.14%, which is quite impressive.
- The Revenue has grown by 17.49% in the past year. This is quite good.
- The Revenue has been growing by 16.47% on average over the past years. This is quite good.
- EXEL is expected to show a strong growth in Earnings Per Share. In the coming years, the EPS will grow by 35.45% yearly.
- When comparing the EPS growth rate of the last years to the growth rate of the upcoming years, we see that the growth is accelerating.
Every day, new Decent Value stocks can be found on ChartMill in our Decent Value screener.
For an up to date full fundamental analysis you can check the fundamental report of EXEL
Disclaimer
This is not investing advice! The article highlights some of the observations at the time of writing, but you should always make your own analysis and invest based on your own insights.