
EXELIXIS INC (NASDAQ:EXEL) has caught the attention of our stock screener as a great value stock. NASDAQ:EXEL excels in profitability, solvency, and liquidity, all while being very reasonably priced. Let's delve into the details.
Valuation Analysis for NASDAQ:EXEL
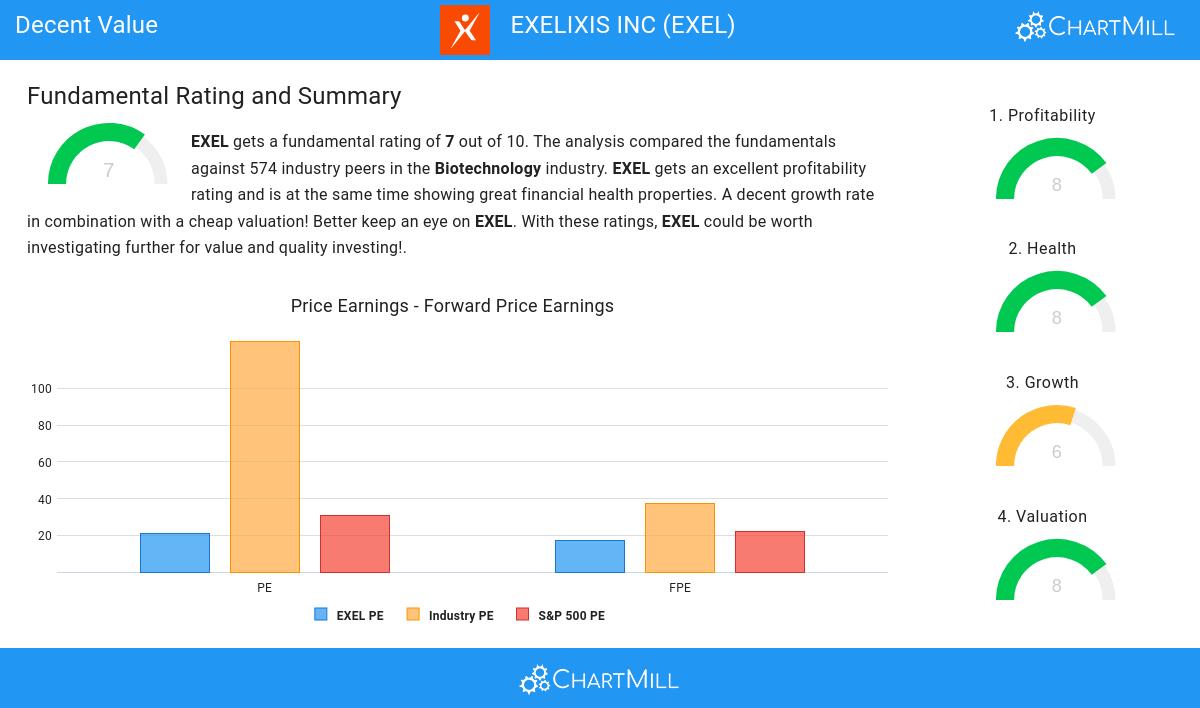
ChartMill assigns a proprietary Valuation Rating to each stock. The score is computed by evaluating various valuation aspects, like price to earnings and free cash flow, both absolutely as relative to the market and industry. NASDAQ:EXEL was assigned a score of 8 for valuation:
- EXEL's Price/Earnings ratio is rather cheap when compared to the industry. EXEL is cheaper than 95.95% of the companies in the same industry.
- The average S&P500 Price/Earnings ratio is at 30.91. EXEL is valued slightly cheaper when compared to this.
- EXEL's Price/Forward Earnings ratio is rather cheap when compared to the industry. EXEL is cheaper than 95.42% of the companies in the same industry.
- EXEL's Price/Forward Earnings ratio indicates a valuation a bit cheaper than the S&P500 average which is at 22.30.
- Based on the Enterprise Value to EBITDA ratio, EXEL is valued cheaply inside the industry as 96.30% of the companies are valued more expensively.
- Based on the Price/Free Cash Flow ratio, EXEL is valued cheaply inside the industry as 96.65% of the companies are valued more expensively.
- The low PEG Ratio(NY), which compensates the Price/Earnings for growth, indicates a rather cheap valuation of the company.
- EXEL has an outstanding profitability rating, which may justify a higher PE ratio.
- A more expensive valuation may be justified as EXEL's earnings are expected to grow with 47.15% in the coming years.
What does the Profitability looks like for NASDAQ:EXEL
Discover ChartMill's exclusive Profitability Rating, a proprietary metric that assesses stocks on a scale of 0 to 10. It takes into consideration various profitability ratios and margins, both in absolute terms and relative to industry peers. Notably, NASDAQ:EXEL has achieved a 8:
- EXEL's Return On Assets of 12.62% is amongst the best of the industry. EXEL outperforms 97.89% of its industry peers.
- The Return On Equity of EXEL (16.51%) is better than 96.65% of its industry peers.
- EXEL has a better Return On Invested Capital (13.15%) than 96.30% of its industry peers.
- The last Return On Invested Capital (13.15%) for EXEL is above the 3 year average (7.03%), which is a sign of increasing profitability.
- The Profit Margin of EXEL (17.38%) is better than 97.01% of its industry peers.
- EXEL has a better Operating Margin (20.00%) than 96.65% of its industry peers.
- Looking at the Gross Margin, with a value of 96.05%, EXEL belongs to the top of the industry, outperforming 96.48% of the companies in the same industry.
Health Analysis for NASDAQ:EXEL
ChartMill employs its own Health Rating for stock assessment. This rating, ranging from 0 to 10, is calculated by examining various liquidity and solvency ratios. In the case of NASDAQ:EXEL, the assigned 8 reflects its health status:
- An Altman-Z score of 8.47 indicates that EXEL is not in any danger for bankruptcy at the moment.
- With an excellent Altman-Z score value of 8.47, EXEL belongs to the best of the industry, outperforming 83.98% of the companies in the same industry.
- EXEL has no outstanding debt. Therefor its Debt/Equity and Debt/FCF ratios are 0 and belong to the best of the industry.
- A Current Ratio of 4.27 indicates that EXEL has no problem at all paying its short term obligations.
- EXEL has a Quick Ratio of 4.21. This indicates that EXEL is financially healthy and has no problem in meeting its short term obligations.
Analyzing Growth Metrics
A key component of ChartMill's stock assessment is the Growth Rating, which spans from 0 to 10. This rating evaluates diverse growth factors, such as EPS and revenue growth, considering both past performance and future projections. NASDAQ:EXEL has received a 6 out of 10:
- The Earnings Per Share has grown by an impressive 143.14% over the past year.
- EXEL shows quite a strong growth in Revenue. In the last year, the Revenue has grown by 17.49%.
- The Revenue has been growing by 16.47% on average over the past years. This is quite good.
- EXEL is expected to show a strong growth in Earnings Per Share. In the coming years, the EPS will grow by 35.45% yearly.
- When comparing the EPS growth rate of the last years to the growth rate of the upcoming years, we see that the growth is accelerating.
Every day, new Decent Value stocks can be found on ChartMill in our Decent Value screener.
For an up to date full fundamental analysis you can check the fundamental report of EXEL
Disclaimer
This article should in no way be interpreted as advice. The article is based on the observed metrics at the time of writing, but you should always make your own analysis and trade or invest at your own responsibility.