
Our stock screening tool has pinpointed EXELIXIS INC (NASDAQ:EXEL) as an undervalued stock. NASDAQ:EXEL maintains a solid financial footing. Furthermore, it remains attractively priced. Let's delve into the specifics below.
Analyzing Valuation Metrics
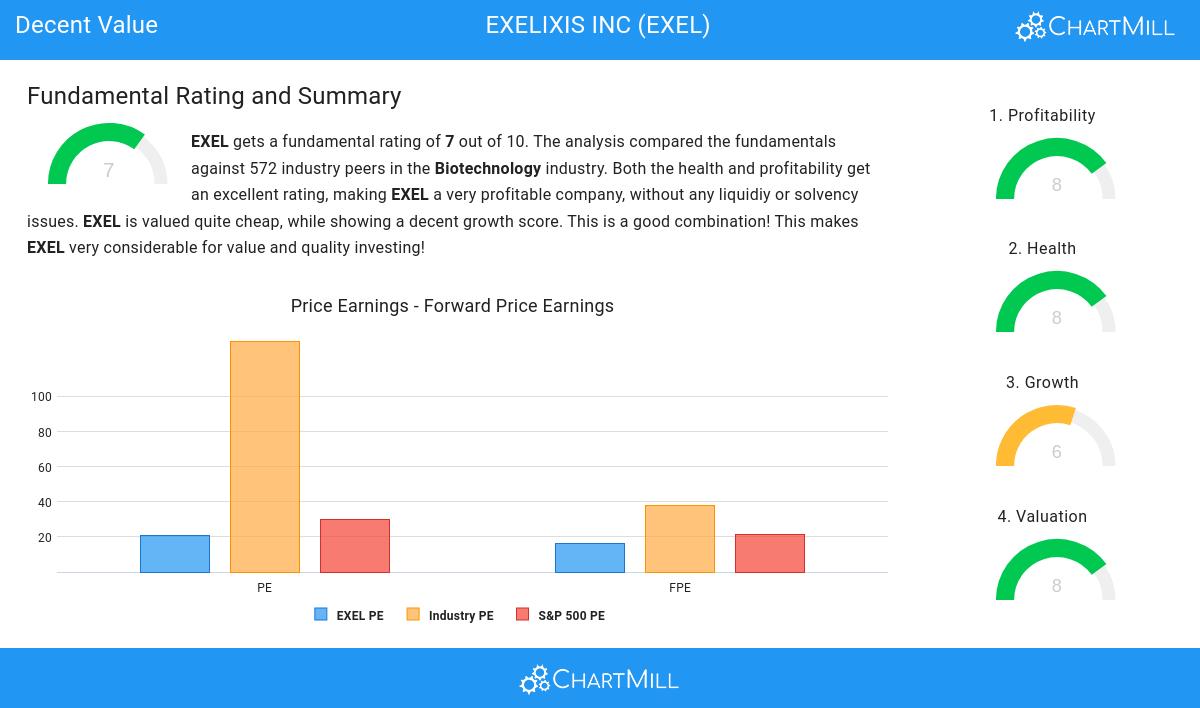
ChartMill assigns a Valuation Rating to every stock. This score ranges from 0 to 10 and evaluates the different valuation aspects and compares the price to earnings and cash flows, while taking into account profitability and growth. NASDAQ:EXEL scores a 8 out of 10:
- Based on the Price/Earnings ratio, EXEL is valued cheaper than 96.48% of the companies in the same industry.
- EXEL is valuated rather cheaply when we compare the Price/Earnings ratio to 29.93, which is the current average of the S&P500 Index.
- EXEL's Price/Forward Earnings ratio is rather cheap when compared to the industry. EXEL is cheaper than 95.60% of the companies in the same industry.
- Compared to an average S&P500 Price/Forward Earnings ratio of 21.45, EXEL is valued a bit cheaper.
- Compared to the rest of the industry, the Enterprise Value to EBITDA ratio of EXEL indicates a rather cheap valuation: EXEL is cheaper than 96.83% of the companies listed in the same industry.
- EXEL's Price/Free Cash Flow ratio is rather cheap when compared to the industry. EXEL is cheaper than 96.65% of the companies in the same industry.
- The low PEG Ratio(NY), which compensates the Price/Earnings for growth, indicates a rather cheap valuation of the company.
- The excellent profitability rating of EXEL may justify a higher PE ratio.
- A more expensive valuation may be justified as EXEL's earnings are expected to grow with 47.15% in the coming years.
Profitability Assessment of NASDAQ:EXEL
ChartMill assigns a Profitability Rating to every stock. This score ranges from 0 to 10 and evaluates the different profitability ratios and margins, both absolutely, but also relative to the industry peers. NASDAQ:EXEL scores a 8 out of 10:
- EXEL has a better Return On Assets (12.62%) than 97.89% of its industry peers.
- EXEL's Return On Equity of 16.51% is amongst the best of the industry. EXEL outperforms 97.01% of its industry peers.
- EXEL has a better Return On Invested Capital (13.15%) than 96.30% of its industry peers.
- The last Return On Invested Capital (13.15%) for EXEL is above the 3 year average (7.03%), which is a sign of increasing profitability.
- With an excellent Profit Margin value of 17.38%, EXEL belongs to the best of the industry, outperforming 97.36% of the companies in the same industry.
- EXEL's Operating Margin of 20.00% is amongst the best of the industry. EXEL outperforms 96.83% of its industry peers.
- EXEL has a Gross Margin of 96.05%. This is amongst the best in the industry. EXEL outperforms 96.83% of its industry peers.
Evaluating Health: NASDAQ:EXEL
Every stock is evaluated by ChartMill, receiving a Health Rating on a scale of 0 to 10. This assessment considers different health aspects, including liquidity and solvency, both in absolute terms and relative to industry peers. NASDAQ:EXEL has achieved a 8 out of 10:
- An Altman-Z score of 8.43 indicates that EXEL is not in any danger for bankruptcy at the moment.
- With an excellent Altman-Z score value of 8.43, EXEL belongs to the best of the industry, outperforming 83.80% of the companies in the same industry.
- EXEL has no outstanding debt. Therefor its Debt/Equity and Debt/FCF ratios are 0 and belong to the best of the industry.
- A Current Ratio of 4.27 indicates that EXEL has no problem at all paying its short term obligations.
- A Quick Ratio of 4.21 indicates that EXEL has no problem at all paying its short term obligations.
Analyzing Growth Metrics
ChartMill assigns a Growth Rating to each stock, ranging from 0 to 10. This rating is determined by analyzing different growth elements, including EPS and revenue growth, spanning both historical and future figures. In the case of NASDAQ:EXEL, the assigned 6 reflects its growth potential:
- The Earnings Per Share has grown by an impressive 143.14% over the past year.
- EXEL shows quite a strong growth in Revenue. In the last year, the Revenue has grown by 17.49%.
- EXEL shows quite a strong growth in Revenue. Measured over the last years, the Revenue has been growing by 16.47% yearly.
- Based on estimates for the next years, EXEL will show a very strong growth in Earnings Per Share. The EPS will grow by 35.45% on average per year.
- The EPS growth rate is accelerating: in the next years the growth will be better than in the last years.
More Decent Value stocks can be found in our Decent Value screener.
Our latest full fundamental report of EXEL contains the most current fundamental analsysis.
Disclaimer
This article should in no way be interpreted as advice. The article is based on the observed metrics at the time of writing, but you should always make your own analysis and trade or invest at your own responsibility.