
Why EATON CORP PLC (NYSE:ETN) provides a good dividend, while having solid fundamentals.
By Mill Chart
Last update: Mar 6, 2025
Unearth the potential of EATON CORP PLC (NYSE:ETN) as a dividend stock recommended by our stock screening tool. NYSE:ETN maintains a robust financial footing and delivers a sustainable dividend. We'll delve into the details below.
Dividend Assessment of NYSE:ETN
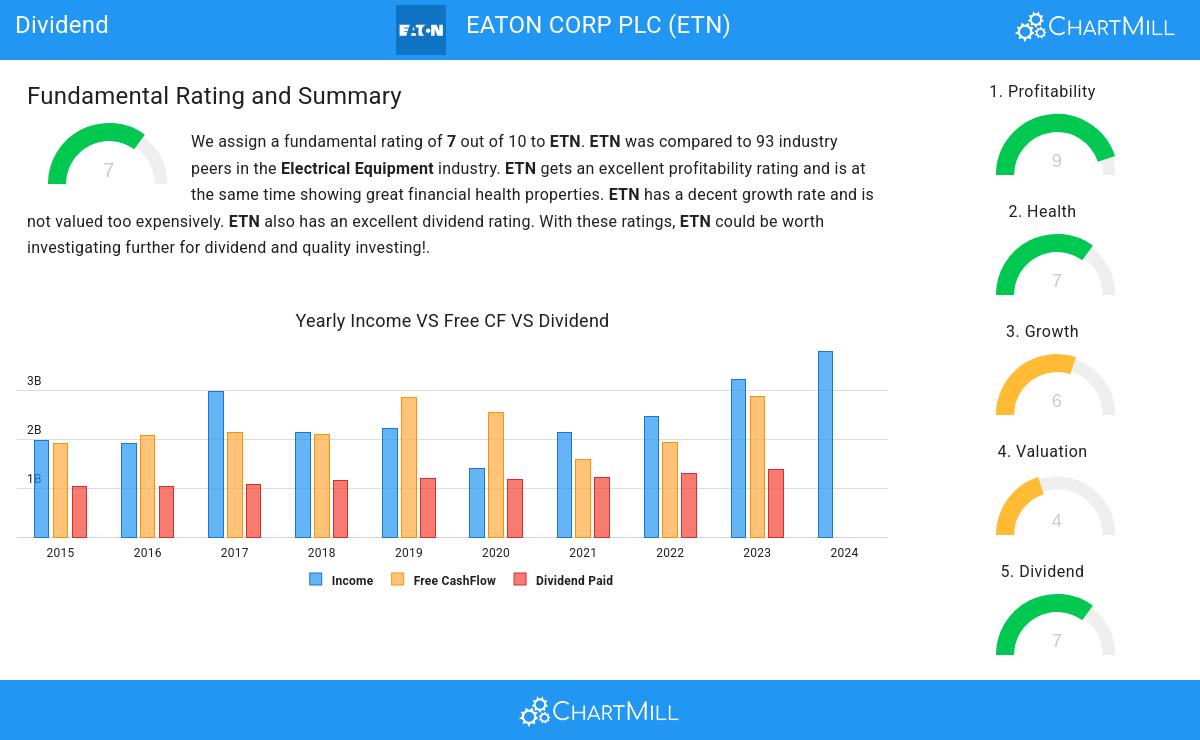
An integral part of ChartMill's stock analysis is the Dividend Rating, which spans from 0 to 10. This rating evaluates diverse dividend factors, including yield, historical data, growth, and sustainability. NYSE:ETN has received a 7 out of 10:
- Compared to an average industry Dividend Yield of 3.73, ETN pays a better dividend. On top of this ETN pays more dividend than 90.32% of the companies listed in the same industry.
- ETN has been paying a dividend for at least 10 years, so it has a reliable track record.
- ETN has not decreased its dividend for at least 10 years, so it has a reliable track record of non decreasing dividend.
- ETN pays out 39.12% of its income as dividend. This is a sustainable payout ratio.
- The dividend of ETN is growing, but earnings are growing more, so the dividend growth is sustainable.
How We Gauge Health for NYSE:ETN
A critical element of ChartMill's stock evaluation is the Health Rating, which spans from 0 to 10. This rating considers multiple health factors, including liquidity and solvency, both in absolute terms and relative to industry peers. NYSE:ETN has received a 7 out of 10:
- An Altman-Z score of 4.90 indicates that ETN is not in any danger for bankruptcy at the moment.
- ETN's Altman-Z score of 4.90 is amongst the best of the industry. ETN outperforms 88.17% of its industry peers.
- The Debt to FCF ratio of ETN is 2.91, which is a good value as it means it would take ETN, 2.91 years of fcf income to pay off all of its debts.
- The Debt to FCF ratio of ETN (2.91) is better than 77.42% of its industry peers.
- A Debt/Equity ratio of 0.45 indicates that ETN is not too dependend on debt financing.
- The current and quick ratio evaluation for ETN is rather negative, while it does have excellent solvency and profitability. These ratios do not necessarly indicate liquidity issues and need to be evaluated against the specifics of the business.
How do we evaluate the Profitability for NYSE:ETN?
ChartMill employs its own Profitability Rating system for stock evaluation. This score, ranging from 0 to 10, is derived from an analysis of diverse profitability metrics and margins. In the case of NYSE:ETN, the assigned 9 is noteworthy for profitability:
- The Return On Assets of ETN (9.60%) is better than 92.47% of its industry peers.
- ETN's Return On Equity of 19.71% is amongst the best of the industry. ETN outperforms 92.47% of its industry peers.
- ETN has a better Return On Invested Capital (12.31%) than 92.47% of its industry peers.
- The 3 year average ROIC (10.83%) for ETN is below the current ROIC(12.31%), indicating increased profibility in the last year.
- ETN has a better Profit Margin (15.31%) than 96.77% of its industry peers.
- In the last couple of years the Profit Margin of ETN has grown nicely.
- ETN has a Operating Margin of 18.71%. This is amongst the best in the industry. ETN outperforms 96.77% of its industry peers.
- ETN's Operating Margin has improved in the last couple of years.
- ETN has a better Gross Margin (37.83%) than 88.17% of its industry peers.
- In the last couple of years the Gross Margin of ETN has grown nicely.
Our Best Dividend screener lists more Best Dividend stocks and is updated daily.
Check the latest full fundamental report of ETN for a complete fundamental analysis.
Disclaimer
This is not investing advice! The article highlights some of the observations at the time of writing, but you should always make your own analysis and invest based on your own insights.
