
Consider EATON CORP PLC (NYSE:ETN) as a top pick for dividend investors, identified by our stock screening tool. NYSE:ETN shines in terms of profitability, solvency, and liquidity, all while paying a decent dividend. Let's dive deeper into the analysis.
Evaluating Dividend: NYSE:ETN
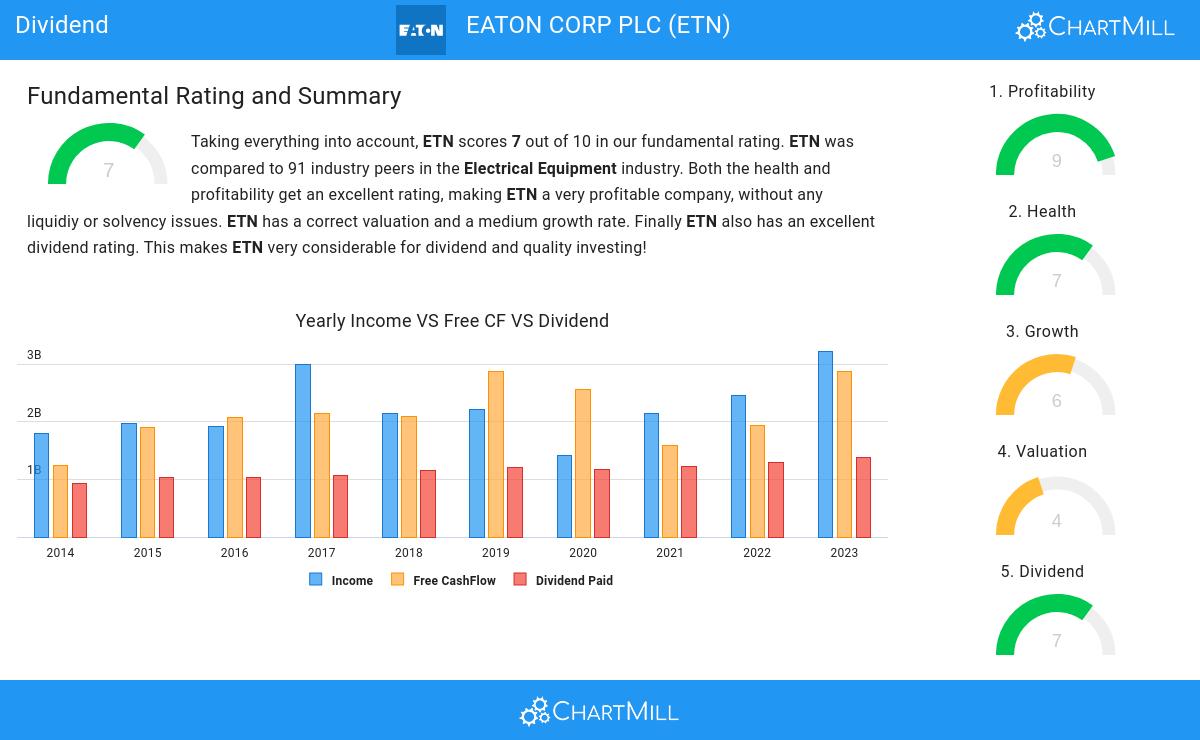
To gauge a stock's dividend quality, ChartMill utilizes a Dividend Rating ranging from 0 to 10. This comprehensive assessment considers various dividend aspects, including yield, history, growth, and sustainability. NYSE:ETN has achieved a 7 out of 10:
- ETN's Dividend Yield is rather good when compared to the industry average which is at 2.20. ETN pays more dividend than 88.76% of the companies in the same industry.
- ETN has been paying a dividend for at least 10 years, so it has a reliable track record.
- ETN has not decreased its dividend for at least 10 years, so it has a reliable track record of non decreasing dividend.
- ETN pays out 39.53% of its income as dividend. This is a sustainable payout ratio.
- ETN's earnings are growing more than its dividend. This makes the dividend growth sustainable.
Health Analysis for NYSE:ETN
To gauge a stock's financial health, ChartMill utilizes a Health Rating on a scale of 0 to 10. This comprehensive evaluation encompasses liquidity and solvency, both in absolute terms and in comparison to industry peers. NYSE:ETN has earned a 7 out of 10:
- ETN has an Altman-Z score of 5.59. This indicates that ETN is financially healthy and has little risk of bankruptcy at the moment.
- The Altman-Z score of ETN (5.59) is better than 88.76% of its industry peers.
- The Debt to FCF ratio of ETN is 3.26, which is a good value as it means it would take ETN, 3.26 years of fcf income to pay off all of its debts.
- The Debt to FCF ratio of ETN (3.26) is better than 76.40% of its industry peers.
- A Debt/Equity ratio of 0.45 indicates that ETN is not too dependend on debt financing.
- The current and quick ratio evaluation for ETN is rather negative, while it does have excellent solvency and profitability. These ratios do not necessarly indicate liquidity issues and need to be evaluated against the specifics of the business.
Analyzing Profitability Metrics
ChartMill assigns a Profitability Rating to every stock. This score ranges from 0 to 10 and evaluates the different profitability ratios and margins, both absolutely, but also relative to the industry peers. NYSE:ETN scores a 9 out of 10:
- The Return On Assets of ETN (9.27%) is better than 92.13% of its industry peers.
- With an excellent Return On Equity value of 18.99%, ETN belongs to the best of the industry, outperforming 92.13% of the companies in the same industry.
- The Return On Invested Capital of ETN (12.11%) is better than 88.76% of its industry peers.
- The 3 year average ROIC (9.14%) for ETN is below the current ROIC(12.11%), indicating increased profibility in the last year.
- With an excellent Profit Margin value of 15.12%, ETN belongs to the best of the industry, outperforming 95.51% of the companies in the same industry.
- ETN's Profit Margin has improved in the last couple of years.
- ETN has a better Operating Margin (18.57%) than 93.26% of its industry peers.
- ETN's Operating Margin has improved in the last couple of years.
- ETN has a Gross Margin of 37.53%. This is amongst the best in the industry. ETN outperforms 89.89% of its industry peers.
- In the last couple of years the Gross Margin of ETN has grown nicely.
Every day, new Best Dividend stocks can be found on ChartMill in our Best Dividend screener.
Check the latest full fundamental report of ETN for a complete fundamental analysis.
Disclaimer
This is not investing advice! The article highlights some of the observations at the time of writing, but you should always make your own analysis and invest based on your own insights.