
Balancing Dividends and Fundamentals: The Case of NYSE:ETN.
By Mill Chart
Last update: Sep 16, 2024
EATON CORP PLC (NYSE:ETN) was identified as a stock worth exploring by dividend investors by our stock screener. NYSE:ETN scores well on profitability, solvency and liquidity. At the same time it seems to pay a decent dividend. We'll explore this a bit deeper below.
Evaluating Dividend: NYSE:ETN
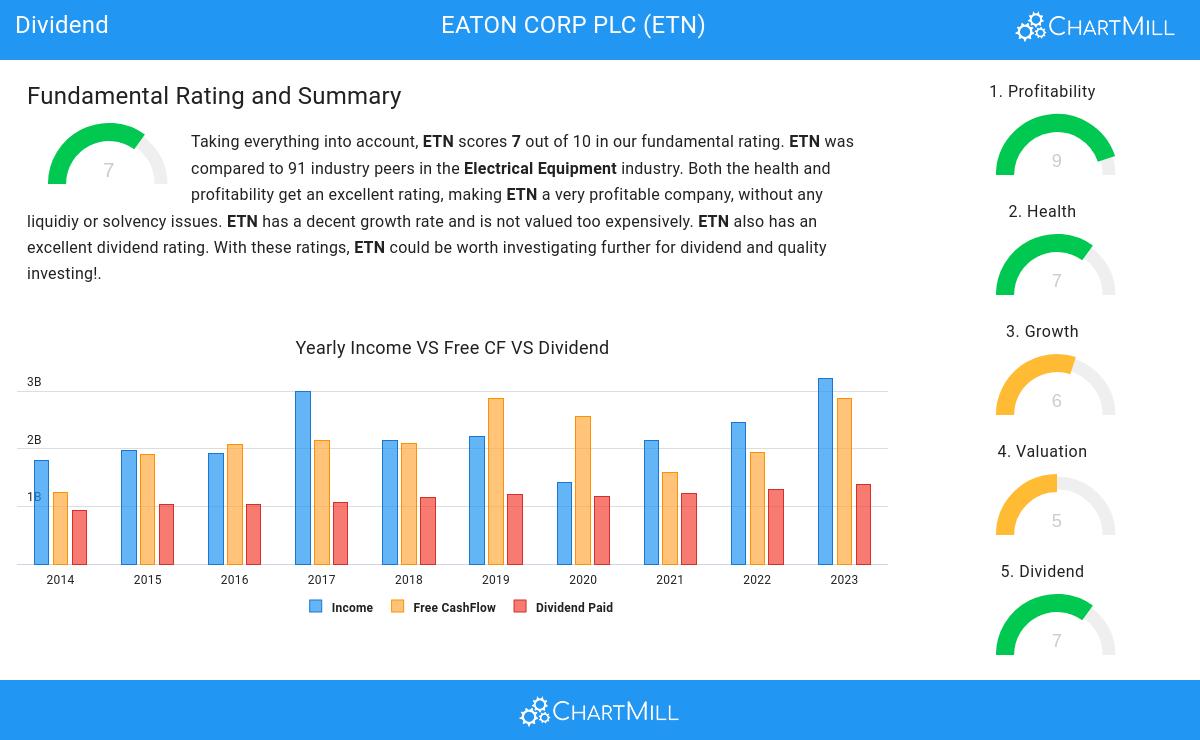
To gauge a stock's dividend quality, ChartMill utilizes a Dividend Rating ranging from 0 to 10. This comprehensive assessment considers various dividend aspects, including yield, history, growth, and sustainability. NYSE:ETN has achieved a 7 out of 10:
- Compared to an average industry Dividend Yield of 2.35, ETN pays a better dividend. On top of this ETN pays more dividend than 88.89% of the companies listed in the same industry.
- ETN has been paying a dividend for at least 10 years, so it has a reliable track record.
- ETN has not decreased their dividend for at least 10 years, which is a reliable track record.
- 39.53% of the earnings are spent on dividend by ETN. This is a low number and sustainable payout ratio.
- The dividend of ETN is growing, but earnings are growing more, so the dividend growth is sustainable.
Health Analysis for NYSE:ETN
ChartMill employs a unique Health Rating system for all stocks. This rating, ranging from 0 to 10, is determined by analyzing various liquidity and solvency ratios. For NYSE:ETN, the assigned 7 for health provides valuable insights:
- An Altman-Z score of 5.13 indicates that ETN is not in any danger for bankruptcy at the moment.
- Looking at the Altman-Z score, with a value of 5.13, ETN belongs to the top of the industry, outperforming 85.56% of the companies in the same industry.
- ETN has a debt to FCF ratio of 3.26. This is a good value and a sign of high solvency as ETN would need 3.26 years to pay back of all of its debts.
- Looking at the Debt to FCF ratio, with a value of 3.26, ETN is in the better half of the industry, outperforming 76.67% of the companies in the same industry.
- ETN has a Debt/Equity ratio of 0.45. This is a healthy value indicating a solid balance between debt and equity.
- ETN does not score too well on the current and quick ratio evaluation. However, as it has excellent solvency and profitability, these ratios do not necessarly indicate liquidity issues and need to be evaluated against the specifics of the business.
Assessing Profitability for NYSE:ETN
ChartMill assigns a Profitability Rating to every stock. This score ranges from 0 to 10 and evaluates the different profitability ratios and margins, both absolutely, but also relative to the industry peers. NYSE:ETN scores a 9 out of 10:
- The Return On Assets of ETN (9.27%) is better than 91.11% of its industry peers.
- ETN has a Return On Equity of 18.99%. This is amongst the best in the industry. ETN outperforms 92.22% of its industry peers.
- ETN's Return On Invested Capital of 12.11% is amongst the best of the industry. ETN outperforms 88.89% of its industry peers.
- The 3 year average ROIC (9.14%) for ETN is below the current ROIC(12.11%), indicating increased profibility in the last year.
- Looking at the Profit Margin, with a value of 15.12%, ETN belongs to the top of the industry, outperforming 95.56% of the companies in the same industry.
- In the last couple of years the Profit Margin of ETN has grown nicely.
- ETN's Operating Margin of 18.57% is amongst the best of the industry. ETN outperforms 93.33% of its industry peers.
- In the last couple of years the Operating Margin of ETN has grown nicely.
- The Gross Margin of ETN (37.53%) is better than 90.00% of its industry peers.
- ETN's Gross Margin has improved in the last couple of years.
Our Best Dividend screener lists more Best Dividend stocks and is updated daily.
Check the latest full fundamental report of ETN for a complete fundamental analysis.
Disclaimer
Important Note: The content of this article is not intended as trading advice. It is essential to perform your own analysis and exercise caution when making trading decisions. The article presents observations created by automated analysis but does not guarantee any trading or investment outcomes. Always trade responsibly and make independent judgments.
