For those who appreciate growth without the sticker shock, NEW ORIENTAL EDUCATIO-SP ADR (NYSE:EDU) is worth considering.
By Mill Chart
Last update: Feb 27, 2025
Our stock screener has spotted NEW ORIENTAL EDUCATIO-SP ADR (NYSE:EDU) as a growth stock which is not overvalued. NYSE:EDU is scoring great on several growth aspects while it also shows decent health and profitability. At the same time it remains remains attractively priced. We'll dive into each aspect below.
Understanding NYSE:EDU's Growth Score
ChartMill employs its own Growth Rating system for all stocks. This score, ranging from 0 to 10, is derived by evaluating different growth factors, such as EPS and revenue growth, taking into account both past performance and future projections. NYSE:EDU has earned a 7 for growth:
- The Earnings Per Share has grown by an impressive 44.32% over the past year.
- The Revenue has grown by 34.42% in the past year. This is a very strong growth!
- Based on estimates for the next years, EDU will show a very strong growth in Earnings Per Share. The EPS will grow by 27.73% on average per year.
- Based on estimates for the next years, EDU will show a quite strong growth in Revenue. The Revenue will grow by 11.28% on average per year.
- The EPS growth rate is accelerating: in the next years the growth will be better than in the last years.
- When comparing the Revenue growth rate of the last years to the growth rate of the upcoming years, we see that the growth is accelerating.
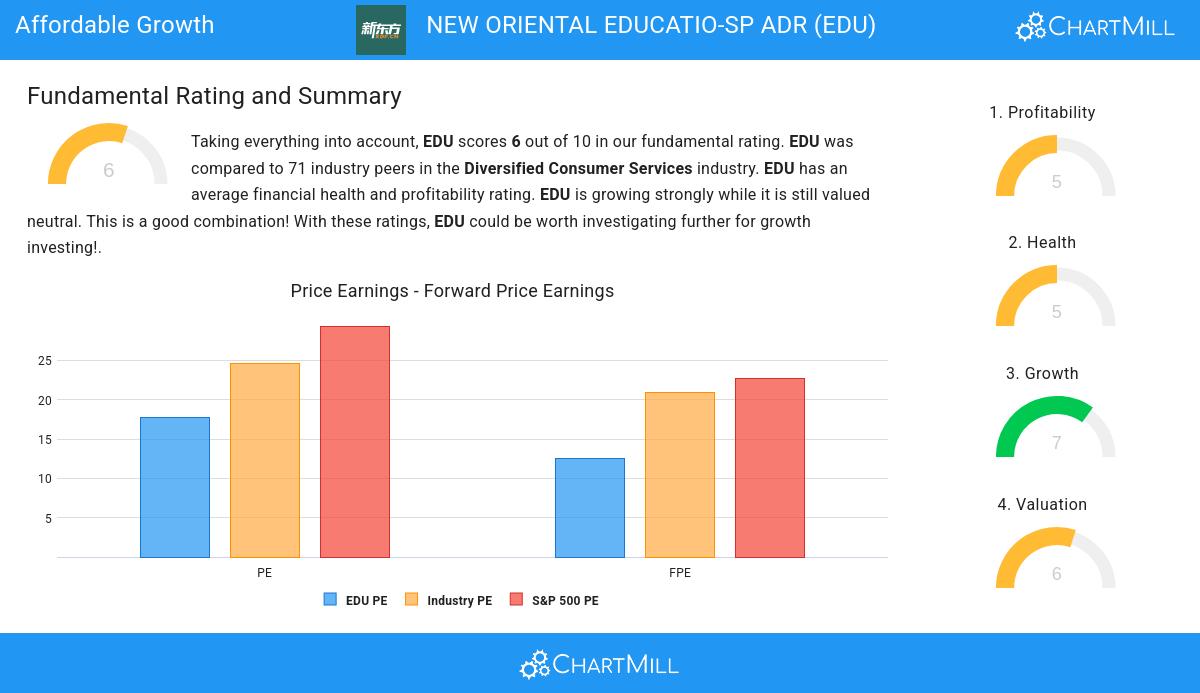
Valuation Assessment of NYSE:EDU
ChartMill employs its own Valuation Rating system for all stocks. This score, ranging from 0 to 10, is determined by evaluating different valuation factors, including price to earnings and free cash flow, both in absolute terms and relative to the market and industry. NYSE:EDU has earned a 6 for valuation:
- Based on the Price/Earnings ratio, EDU is valued a bit cheaper than 71.88% of the companies in the same industry.
- EDU's Price/Earnings ratio indicates a valuation a bit cheaper than the S&P500 average which is at 29.36.
- 85.94% of the companies in the same industry are more expensive than EDU, based on the Price/Forward Earnings ratio.
- When comparing the Price/Forward Earnings ratio of EDU to the average of the S&P500 Index (22.65), we can say EDU is valued slightly cheaper.
- 93.75% of the companies in the same industry are more expensive than EDU, based on the Price/Free Cash Flow ratio.
- The low PEG Ratio(NY), which compensates the Price/Earnings for growth, indicates a rather cheap valuation of the company.
- A more expensive valuation may be justified as EDU's earnings are expected to grow with 27.73% in the coming years.
How We Gauge Health for NYSE:EDU
ChartMill utilizes a Health Rating to assess stocks, scoring them on a scale of 0 to 10. This rating takes into account a variety of liquidity and solvency ratios, both in absolute terms and in comparison to industry peers. NYSE:EDU has earned a 5 out of 10:
- The Debt to FCF ratio of EDU is 0.01, which is an excellent value as it means it would take EDU, only 0.01 years of fcf income to pay off all of its debts.
- Looking at the Debt to FCF ratio, with a value of 0.01, EDU belongs to the top of the industry, outperforming 85.94% of the companies in the same industry.
- A Debt/Equity ratio of 0.00 indicates that EDU is not too dependend on debt financing.
- EDU has a better Debt to Equity ratio (0.00) than 75.00% of its industry peers.
- The Current ratio of EDU (1.71) is better than 65.63% of its industry peers.
- EDU has a Quick ratio of 1.68. This is in the better half of the industry: EDU outperforms 67.19% of its industry peers.
Assessing Profitability for NYSE:EDU
ChartMill assigns a Profitability Rating to every stock. This score ranges from 0 to 10 and evaluates the different profitability ratios and margins, both absolutely, but also relative to the industry peers. NYSE:EDU scores a 5 out of 10:
- With a decent Return On Assets value of 5.13%, EDU is doing good in the industry, outperforming 71.88% of the companies in the same industry.
- EDU's Return On Equity of 10.58% is fine compared to the rest of the industry. EDU outperforms 68.75% of its industry peers.
- With a decent Return On Invested Capital value of 7.58%, EDU is doing good in the industry, outperforming 78.13% of the companies in the same industry.
- EDU has a Profit Margin of 8.13%. This is in the better half of the industry: EDU outperforms 70.31% of its industry peers.
- Looking at the Operating Margin, with a value of 9.06%, EDU is in the better half of the industry, outperforming 65.63% of the companies in the same industry.
- EDU's Gross Margin of 52.91% is fine compared to the rest of the industry. EDU outperforms 65.63% of its industry peers.
Every day, new Affordable Growth stocks can be found on ChartMill in our Affordable Growth screener.
For an up to date full fundamental analysis you can check the fundamental report of EDU
Keep in mind
This article should in no way be interpreted as advice. The article is based on the observed metrics at the time of writing, but you should always make your own analysis and trade or invest at your own responsibility.
NYSE:EDU (4/21/2025, 11:02:09 AM)
44.905
+0.09 (+0.19%)
Find more stocks in the Stock Screener
EDU Latest News and Analysis
 7 days ago - ChartmillInvestors seeking growth at a reasonable cost should explore NEW ORIENTAL EDUCATIO-SP ADR (NYSE:EDU).
Based on Fundamental Analysis it can be said that NYSE:EDU is a growth stock which is not overvalued.
