
NYSE:EDU is not too expensive for the growth it is showing.
By Mill Chart
Last update: Feb 6, 2025
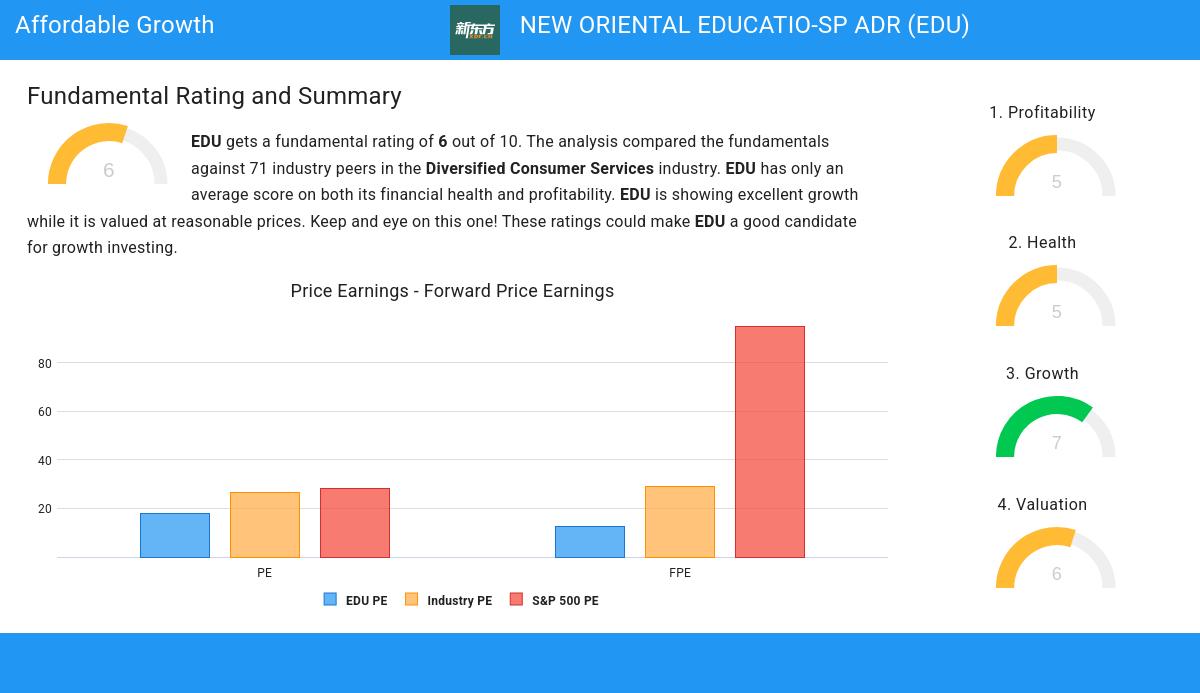
Here's NEW ORIENTAL EDUCATIO-SP ADR (NYSE:EDU) for you, a growth stock our stock screener believes is undervalued. NYSE:EDU is scoring impressively in terms of growth while demonstrating strong financials. On top of that, it remains attractively priced. Let's break it down further.
Growth Assessment of NYSE:EDU
To evaluate a stock's growth potential, ChartMill utilizes a Growth Rating on a scale of 0 to 10. This comprehensive assessment considers various growth aspects, including historical and estimated EPS and revenue growth. NYSE:EDU has achieved a 7 out of 10:
- EDU shows a strong growth in Earnings Per Share. In the last year, the EPS has been growing by 44.32%, which is quite impressive.
- The Revenue has grown by 34.42% in the past year. This is a very strong growth!
- Based on estimates for the next years, EDU will show a very strong growth in Earnings Per Share. The EPS will grow by 28.36% on average per year.
- Based on estimates for the next years, EDU will show a quite strong growth in Revenue. The Revenue will grow by 11.28% on average per year.
- The EPS growth rate is accelerating: in the next years the growth will be better than in the last years.
- When comparing the Revenue growth rate of the last years to the growth rate of the upcoming years, we see that the growth is accelerating.
Analyzing Valuation Metrics
ChartMill assigns a Valuation Rating to each stock, ranging from 0 to 10. This rating is calculated by analyzing different valuation elements, such as price to earnings and free cash flow, both in absolute terms and relative to the market and industry. In the case of NYSE:EDU, the assigned 6 reflects its valuation:
- Based on the Price/Earnings ratio, EDU is valued a bit cheaper than 78.13% of the companies in the same industry.
- Compared to an average S&P500 Price/Earnings ratio of 28.35, EDU is valued a bit cheaper.
- Based on the Price/Forward Earnings ratio, EDU is valued cheaply inside the industry as 87.50% of the companies are valued more expensively.
- EDU's Price/Forward Earnings ratio indicates a rather cheap valuation when compared to the S&P500 average which is at 95.00.
- Based on the Price/Free Cash Flow ratio, EDU is valued cheaper than 93.75% of the companies in the same industry.
- EDU's low PEG Ratio(NY), which compensates the Price/Earnings for growth, indicates a rather cheap valuation of the company.
- A more expensive valuation may be justified as EDU's earnings are expected to grow with 28.36% in the coming years.
What does the Health looks like for NYSE:EDU
ChartMill utilizes a Health Rating to assess stocks, scoring them on a scale of 0 to 10. This rating takes into account a variety of liquidity and solvency ratios, both in absolute terms and in comparison to industry peers. NYSE:EDU has earned a 5 out of 10:
- EDU has a debt to FCF ratio of 0.01. This is a very positive value and a sign of high solvency as it would only need 0.01 years to pay back of all of its debts.
- EDU has a Debt to FCF ratio of 0.01. This is amongst the best in the industry. EDU outperforms 84.38% of its industry peers.
- A Debt/Equity ratio of 0.00 indicates that EDU is not too dependend on debt financing.
- EDU has a Debt to Equity ratio of 0.00. This is in the better half of the industry: EDU outperforms 73.44% of its industry peers.
- Looking at the Current ratio, with a value of 1.71, EDU is in the better half of the industry, outperforming 62.50% of the companies in the same industry.
- EDU's Quick ratio of 1.68 is fine compared to the rest of the industry. EDU outperforms 62.50% of its industry peers.
How do we evaluate the Profitability for NYSE:EDU?
Discover ChartMill's exclusive Profitability Rating, a proprietary metric that assesses stocks on a scale of 0 to 10. It takes into consideration various profitability ratios and margins, both in absolute terms and relative to industry peers. Notably, NYSE:EDU has achieved a 5:
- The Return On Assets of EDU (5.13%) is better than 73.44% of its industry peers.
- Looking at the Return On Equity, with a value of 10.58%, EDU is in the better half of the industry, outperforming 70.31% of the companies in the same industry.
- EDU's Return On Invested Capital of 7.58% is fine compared to the rest of the industry. EDU outperforms 78.13% of its industry peers.
- With a decent Profit Margin value of 8.13%, EDU is doing good in the industry, outperforming 70.31% of the companies in the same industry.
- With a decent Operating Margin value of 9.06%, EDU is doing good in the industry, outperforming 68.75% of the companies in the same industry.
- The Gross Margin of EDU (52.91%) is better than 62.50% of its industry peers.
Our Affordable Growth screener lists more Affordable Growth stocks and is updated daily.
Check the latest full fundamental report of EDU for a complete fundamental analysis.
Keep in mind
This article should in no way be interpreted as advice. The article is based on the observed metrics at the time of writing, but you should always make your own analysis and trade or invest at your own responsibility.
NYSE:EDU (12/11/2025, 3:50:01 PM)
52.995
-0.68 (-1.26%)
Find more stocks in the Stock Screener
