
Our stock screener has singled out NEW ORIENTAL EDUCATIO-SP ADR (NYSE:EDU) as an attractive growth opportunity. NYSE:EDU is demonstrating remarkable growth potential while maintaining strong financial indicators, making it a reasonably priced option. We'll explore this further.
Growth Assessment of NYSE:EDU
A key component of ChartMill's stock assessment is the Growth Rating, which spans from 0 to 10. This rating evaluates diverse growth factors, such as EPS and revenue growth, considering both past performance and future projections. NYSE:EDU has received a 8 out of 10:
- The Earnings Per Share has grown by an impressive 146.74% over the past year.
- The Revenue has grown by 43.89% in the past year. This is a very strong growth!
- EDU is expected to show a strong growth in Earnings Per Share. In the coming years, the EPS will grow by 37.59% yearly.
- EDU is expected to show a strong growth in Revenue. In the coming years, the Revenue will grow by 21.30% yearly.
- The EPS growth rate is accelerating: in the next years the growth will be better than in the last years.
- When comparing the Revenue growth rate of the last years to the growth rate of the upcoming years, we see that the growth is accelerating.
Understanding NYSE:EDU's Valuation
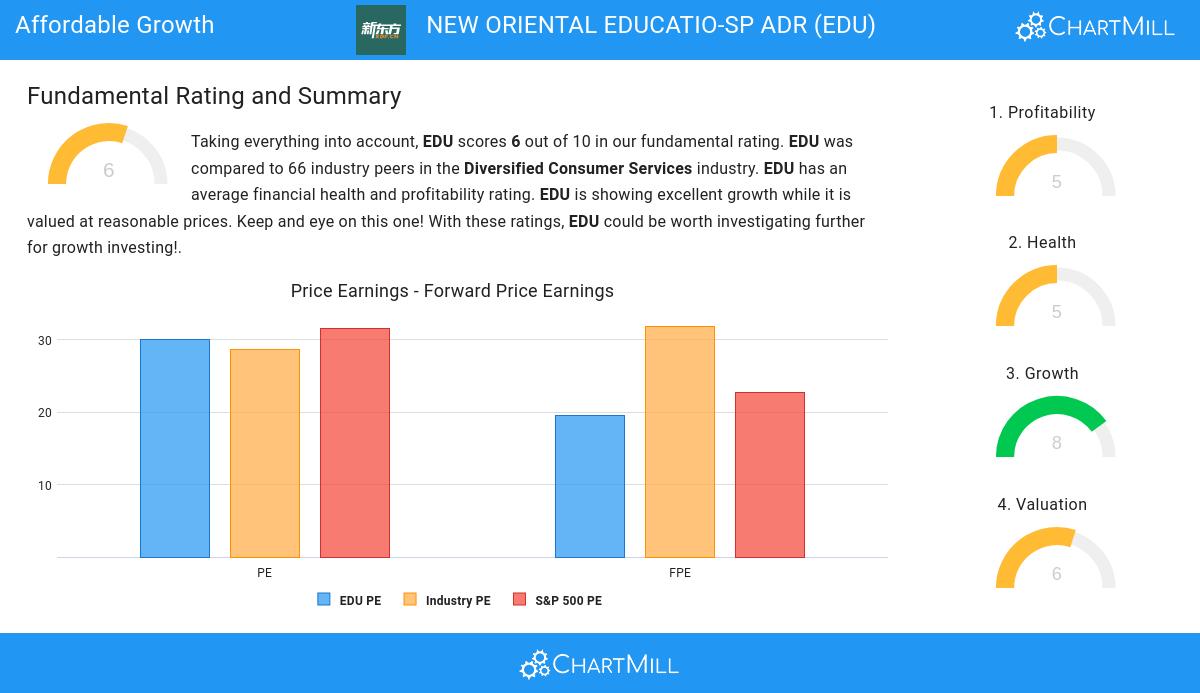
ChartMill assigns a Valuation Rating to each stock, ranging from 0 to 10. This rating is calculated by analyzing different valuation elements, such as price to earnings and free cash flow, both in absolute terms and relative to the market and industry. In the case of NYSE:EDU, the assigned 6 reflects its valuation:
- EDU's Price/Earnings ratio is a bit cheaper when compared to the industry. EDU is cheaper than 60.94% of the companies in the same industry.
- Compared to the rest of the industry, the Price/Forward Earnings ratio of EDU indicates a somewhat cheap valuation: EDU is cheaper than 62.50% of the companies listed in the same industry.
- 81.25% of the companies in the same industry are more expensive than EDU, based on the Enterprise Value to EBITDA ratio.
- Based on the Price/Free Cash Flow ratio, EDU is valued cheaper than 85.94% of the companies in the same industry.
- The low PEG Ratio(NY), which compensates the Price/Earnings for growth, indicates a rather cheap valuation of the company.
- A more expensive valuation may be justified as EDU's earnings are expected to grow with 37.59% in the coming years.
Analyzing Health Metrics
ChartMill employs a unique Health Rating system for all stocks. This rating, ranging from 0 to 10, is determined by analyzing various liquidity and solvency ratios. For NYSE:EDU, the assigned 5 for health provides valuable insights:
- The Debt to FCF ratio of EDU is 0.02, which is an excellent value as it means it would take EDU, only 0.02 years of fcf income to pay off all of its debts.
- With an excellent Debt to FCF ratio value of 0.02, EDU belongs to the best of the industry, outperforming 85.94% of the companies in the same industry.
- A Debt/Equity ratio of 0.00 indicates that EDU is not too dependend on debt financing.
- The Debt to Equity ratio of EDU (0.00) is better than 73.44% of its industry peers.
- EDU has a better Current ratio (1.80) than 65.63% of its industry peers.
- With a decent Quick ratio value of 1.76, EDU is doing good in the industry, outperforming 67.19% of the companies in the same industry.
Assessing Profitability for NYSE:EDU
Discover ChartMill's exclusive Profitability Rating, a proprietary metric that assesses stocks on a scale of 0 to 10. It takes into consideration various profitability ratios and margins, both in absolute terms and relative to industry peers. Notably, NYSE:EDU has achieved a 5:
- EDU has a better Return On Assets (4.11%) than 73.44% of its industry peers.
- The Return On Equity of EDU (8.20%) is better than 64.06% of its industry peers.
- EDU has a Return On Invested Capital of 6.05%. This is in the better half of the industry: EDU outperforms 78.13% of its industry peers.
- With a decent Profit Margin value of 7.18%, EDU is doing good in the industry, outperforming 68.75% of the companies in the same industry.
- EDU has a better Operating Margin (8.12%) than 67.19% of its industry peers.
More Affordable Growth stocks can be found in our Affordable Growth screener.
For an up to date full fundamental analysis you can check the fundamental report of EDU
Keep in mind
This article should in no way be interpreted as advice. The article is based on the observed metrics at the time of writing, but you should always make your own analysis and trade or invest at your own responsibility.