
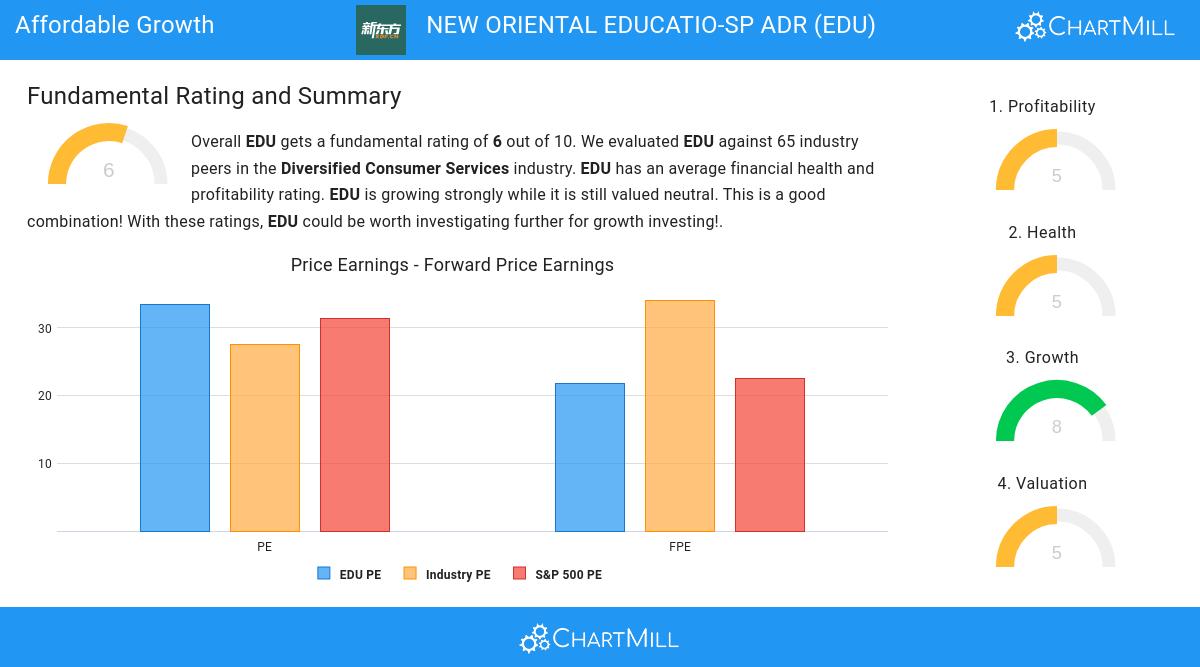
Our stock screener has spotted NEW ORIENTAL EDUCATIO-SP ADR (NYSE:EDU) as a growth stock which is not overvalued. NYSE:EDU is scoring great on several growth aspects while it also shows decent health and profitability. At the same time it remains remains attractively priced. We'll dive into each aspect below.
A Closer Look at Growth for NYSE:EDU
To evaluate a stock's growth potential, ChartMill utilizes a Growth Rating on a scale of 0 to 10. This comprehensive assessment considers various growth aspects, including historical and estimated EPS and revenue growth. NYSE:EDU has achieved a 8 out of 10:
- The Earnings Per Share has grown by an impressive 146.74% over the past year.
- The Revenue has grown by 43.89% in the past year. This is a very strong growth!
- The Earnings Per Share is expected to grow by 37.59% on average over the next years. This is a very strong growth
- Based on estimates for the next years, EDU will show a very strong growth in Revenue. The Revenue will grow by 21.30% on average per year.
- The EPS growth rate is accelerating: in the next years the growth will be better than in the last years.
- When comparing the Revenue growth rate of the last years to the growth rate of the upcoming years, we see that the growth is accelerating.
Looking at the Valuation
To assess a stock's valuation, ChartMill utilizes a Valuation Rating on a scale of 0 to 10. This comprehensive assessment considers various valuation aspects, comparing price to earnings and cash flows, while factoring in profitability and growth. NYSE:EDU has achieved a 5 out of 10:
- EDU's Price/Forward Earnings ratio is a bit cheaper when compared to the industry. EDU is cheaper than 62.50% of the companies in the same industry.
- Compared to the rest of the industry, the Enterprise Value to EBITDA ratio of EDU indicates a somewhat cheap valuation: EDU is cheaper than 76.56% of the companies listed in the same industry.
- Based on the Price/Free Cash Flow ratio, EDU is valued cheaply inside the industry as 81.25% of the companies are valued more expensively.
- The low PEG Ratio(NY), which compensates the Price/Earnings for growth, indicates a rather cheap valuation of the company.
- A more expensive valuation may be justified as EDU's earnings are expected to grow with 37.59% in the coming years.
How We Gauge Health for NYSE:EDU
To gauge a stock's financial health, ChartMill utilizes a Health Rating on a scale of 0 to 10. This comprehensive evaluation encompasses liquidity and solvency, both in absolute terms and in comparison to industry peers. NYSE:EDU has earned a 5 out of 10:
- EDU has a debt to FCF ratio of 0.02. This is a very positive value and a sign of high solvency as it would only need 0.02 years to pay back of all of its debts.
- EDU has a better Debt to FCF ratio (0.02) than 85.94% of its industry peers.
- A Debt/Equity ratio of 0.00 indicates that EDU is not too dependend on debt financing.
- With a decent Debt to Equity ratio value of 0.00, EDU is doing good in the industry, outperforming 73.44% of the companies in the same industry.
- The Current ratio of EDU (1.80) is better than 65.63% of its industry peers.
- EDU's Quick ratio of 1.76 is fine compared to the rest of the industry. EDU outperforms 67.19% of its industry peers.
What does the Profitability looks like for NYSE:EDU
Discover ChartMill's exclusive Profitability Rating, a proprietary metric that assesses stocks on a scale of 0 to 10. It takes into consideration various profitability ratios and margins, both in absolute terms and relative to industry peers. Notably, NYSE:EDU has achieved a 5:
- The Return On Assets of EDU (4.11%) is better than 73.44% of its industry peers.
- EDU has a better Return On Equity (8.20%) than 64.06% of its industry peers.
- With a decent Return On Invested Capital value of 6.05%, EDU is doing good in the industry, outperforming 78.13% of the companies in the same industry.
- The Profit Margin of EDU (7.18%) is better than 68.75% of its industry peers.
- With a decent Operating Margin value of 8.12%, EDU is doing good in the industry, outperforming 67.19% of the companies in the same industry.
More Affordable Growth stocks can be found in our Affordable Growth screener.
Check the latest full fundamental report of EDU for a complete fundamental analysis.
Disclaimer
This is not investing advice! The article highlights some of the observations at the time of writing, but you should always make your own analysis and invest based on your own insights.
