
For those who appreciate growth without the sticker shock, NASDAQ:DXCM is worth considering.
By Mill Chart
Last update: Jan 31, 2025
Our stock screening tool has pinpointed DEXCOM INC (NASDAQ:DXCM) as a growth stock that isn't overvalued. NASDAQ:DXCM is excelling in various growth indicators while maintaining a solid financial footing. Furthermore, it remains attractively priced. Let's delve into the specifics below.
Growth Assessment of NASDAQ:DXCM
ChartMill assigns a Growth Rating to each stock, ranging from 0 to 10. This rating is determined by analyzing different growth elements, including EPS and revenue growth, spanning both historical and future figures. In the case of NASDAQ:DXCM, the assigned 8 reflects its growth potential:
- DXCM shows a strong growth in Earnings Per Share. In the last year, the EPS has been growing by 25.93%, which is quite impressive.
- Measured over the past years, DXCM shows a very strong growth in Earnings Per Share. The EPS has been growing by 83.54% on average per year.
- Looking at the last year, DXCM shows a quite strong growth in Revenue. The Revenue has grown by 16.19% in the last year.
- Measured over the past years, DXCM shows a very strong growth in Revenue. The Revenue has been growing by 28.56% on average per year.
- The Earnings Per Share is expected to grow by 18.56% on average over the next years. This is quite good.
- Based on estimates for the next years, DXCM will show a quite strong growth in Revenue. The Revenue will grow by 14.25% on average per year.
Understanding NASDAQ:DXCM's Valuation Score
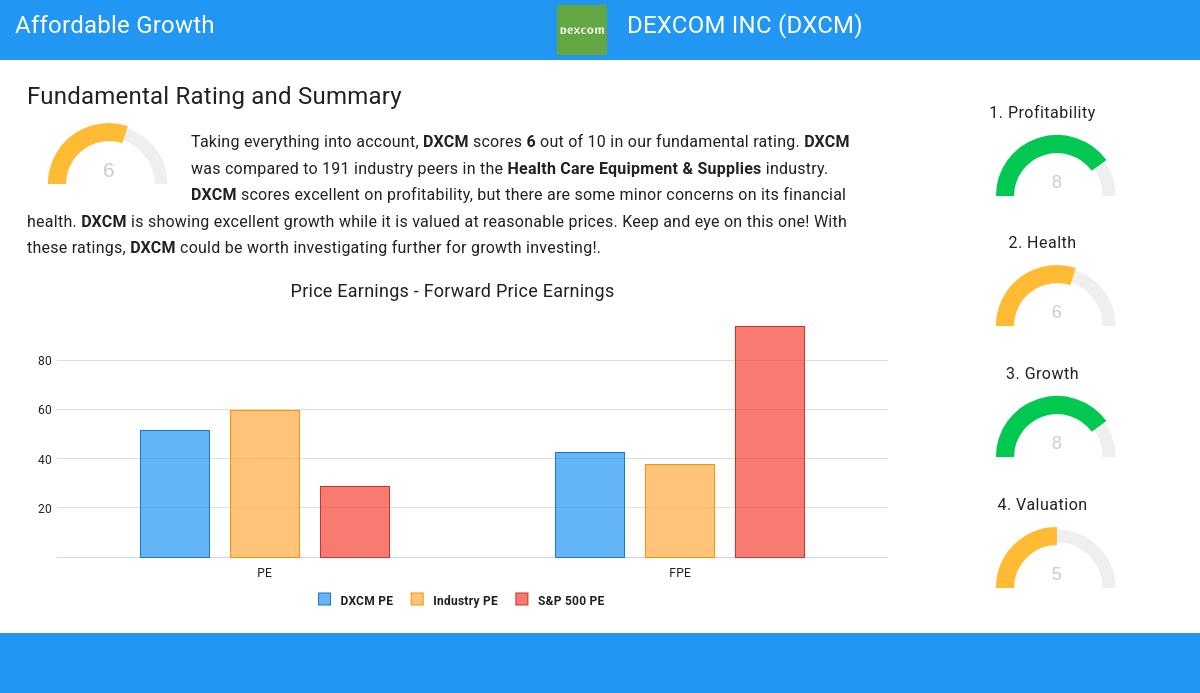
To assess a stock's valuation, ChartMill utilizes a Valuation Rating on a scale of 0 to 10. This comprehensive assessment considers various valuation aspects, comparing price to earnings and cash flows, while factoring in profitability and growth. NASDAQ:DXCM has achieved a 5 out of 10:
- Compared to the rest of the industry, the Price/Earnings ratio of DXCM indicates a somewhat cheap valuation: DXCM is cheaper than 67.89% of the companies listed in the same industry.
- DXCM's Price/Forward Earnings ratio is a bit cheaper when compared to the industry. DXCM is cheaper than 71.05% of the companies in the same industry.
- Compared to an average S&P500 Price/Forward Earnings ratio of 93.88, DXCM is valued rather cheaply.
- Based on the Enterprise Value to EBITDA ratio, DXCM is valued a bit cheaper than the industry average as 68.42% of the companies are valued more expensively.
- 73.68% of the companies in the same industry are more expensive than DXCM, based on the Price/Free Cash Flow ratio.
- DXCM has an outstanding profitability rating, which may justify a higher PE ratio.
- A more expensive valuation may be justified as DXCM's earnings are expected to grow with 18.59% in the coming years.
ChartMill's Evaluation of Health
To gauge a stock's financial health, ChartMill utilizes a Health Rating on a scale of 0 to 10. This comprehensive evaluation encompasses liquidity and solvency, both in absolute terms and in comparison to industry peers. NASDAQ:DXCM has earned a 6 out of 10:
- DXCM has an Altman-Z score of 6.45. This indicates that DXCM is financially healthy and has little risk of bankruptcy at the moment.
- The Altman-Z score of DXCM (6.45) is better than 81.58% of its industry peers.
- DXCM's Debt to FCF ratio of 4.67 is amongst the best of the industry. DXCM outperforms 81.58% of its industry peers.
- DXCM has a Current Ratio of 2.46. This indicates that DXCM is financially healthy and has no problem in meeting its short term obligations.
- DXCM has a Quick Ratio of 2.12. This indicates that DXCM is financially healthy and has no problem in meeting its short term obligations.
Understanding NASDAQ:DXCM's Profitability
ChartMill employs its own Profitability Rating system for stock evaluation. This score, ranging from 0 to 10, is derived from an analysis of diverse profitability metrics and margins. In the case of NASDAQ:DXCM, the assigned 8 is noteworthy for profitability:
- The Return On Assets of DXCM (10.71%) is better than 92.11% of its industry peers.
- With an excellent Return On Equity value of 34.40%, DXCM belongs to the best of the industry, outperforming 97.89% of the companies in the same industry.
- DXCM's Return On Invested Capital of 11.41% is amongst the best of the industry. DXCM outperforms 92.63% of its industry peers.
- The 3 year average ROIC (8.57%) for DXCM is below the current ROIC(11.41%), indicating increased profibility in the last year.
- DXCM's Profit Margin of 17.22% is amongst the best of the industry. DXCM outperforms 92.11% of its industry peers.
- DXCM's Operating Margin of 16.30% is amongst the best of the industry. DXCM outperforms 88.42% of its industry peers.
- DXCM's Gross Margin of 62.10% is fine compared to the rest of the industry. DXCM outperforms 64.21% of its industry peers.
Our Affordable Growth screener lists more Affordable Growth stocks and is updated daily.
Check the latest full fundamental report of DXCM for a complete fundamental analysis.
Keep in mind
Important Note: The content of this article is not intended as trading advice. It is essential to perform your own analysis and exercise caution when making trading decisions. The article presents observations created by automated analysis but does not guarantee any trading or investment outcomes. Always trade responsibly and make independent judgments.