
Why NASDAQ:DXCM Is a Promising High-Growth Stock in the Midst of Consolidation.
By Mill Chart
Last update: Oct 16, 2024
Exploring Growth Potential: DEXCOM INC (NASDAQ:DXCM) and Its Base Formation. Growth investors seek promising revenue and EPS growth, and DEXCOM INC has come under our scrutiny for potential growth investing. While it's crucial to do your own research, we've detected DEXCOM INC on our screen for growth with base formation, suggesting it merits a closer look.
A Closer Look at Growth for NASDAQ:DXCM
ChartMill assigns a proprietary Growth Rating to each stock. The score is computed by evaluating various growth aspects, like EPS and revenue growth. We take into account the history as well as the estimated future numbers. NASDAQ:DXCM was assigned a score of 9 for growth:
- The Earnings Per Share has grown by an impressive 54.87% over the past year.
- Measured over the past years, DXCM shows a very strong growth in Earnings Per Share. The EPS has been growing by 83.54% on average per year.
- DXCM shows a strong growth in Revenue. In the last year, the Revenue has grown by 23.05%.
- The Revenue has been growing by 28.56% on average over the past years. This is a very strong growth!
- The Earnings Per Share is expected to grow by 21.67% on average over the next years. This is a very strong growth
- The Revenue is expected to grow by 17.04% on average over the next years. This is quite good.
How We Gauge Health for NASDAQ:DXCM
ChartMill utilizes a Health Rating to assess stocks, scoring them on a scale of 0 to 10. This rating takes into account a variety of liquidity and solvency ratios, both in absolute terms and in comparison to industry peers. NASDAQ:DXCM has earned a 6 out of 10:
- An Altman-Z score of 5.44 indicates that DXCM is not in any danger for bankruptcy at the moment.
- DXCM's Altman-Z score of 5.44 is fine compared to the rest of the industry. DXCM outperforms 79.57% of its industry peers.
- The Debt to FCF ratio of DXCM is 3.75, which is a good value as it means it would take DXCM, 3.75 years of fcf income to pay off all of its debts.
- With an excellent Debt to FCF ratio value of 3.75, DXCM belongs to the best of the industry, outperforming 86.02% of the companies in the same industry.
- A Current Ratio of 2.82 indicates that DXCM has no problem at all paying its short term obligations.
- A Quick Ratio of 2.48 indicates that DXCM has no problem at all paying its short term obligations.
Profitability Examination for NASDAQ:DXCM
Discover ChartMill's exclusive Profitability Rating, a proprietary metric that assesses stocks on a scale of 0 to 10. It takes into consideration various profitability ratios and margins, both in absolute terms and relative to industry peers. Notably, NASDAQ:DXCM has achieved a 8:
- The Return On Assets of DXCM (9.81%) is better than 90.86% of its industry peers.
- DXCM has a better Return On Equity (27.40%) than 96.77% of its industry peers.
- The Return On Invested Capital of DXCM (11.24%) is better than 92.47% of its industry peers.
- The 3 year average ROIC (8.57%) for DXCM is below the current ROIC(11.24%), indicating increased profibility in the last year.
- Looking at the Profit Margin, with a value of 16.95%, DXCM belongs to the top of the industry, outperforming 92.47% of the companies in the same industry.
- With an excellent Operating Margin value of 17.74%, DXCM belongs to the best of the industry, outperforming 89.78% of the companies in the same industry.
- DXCM has a better Gross Margin (63.16%) than 63.98% of its industry peers.
Looking at the Setup
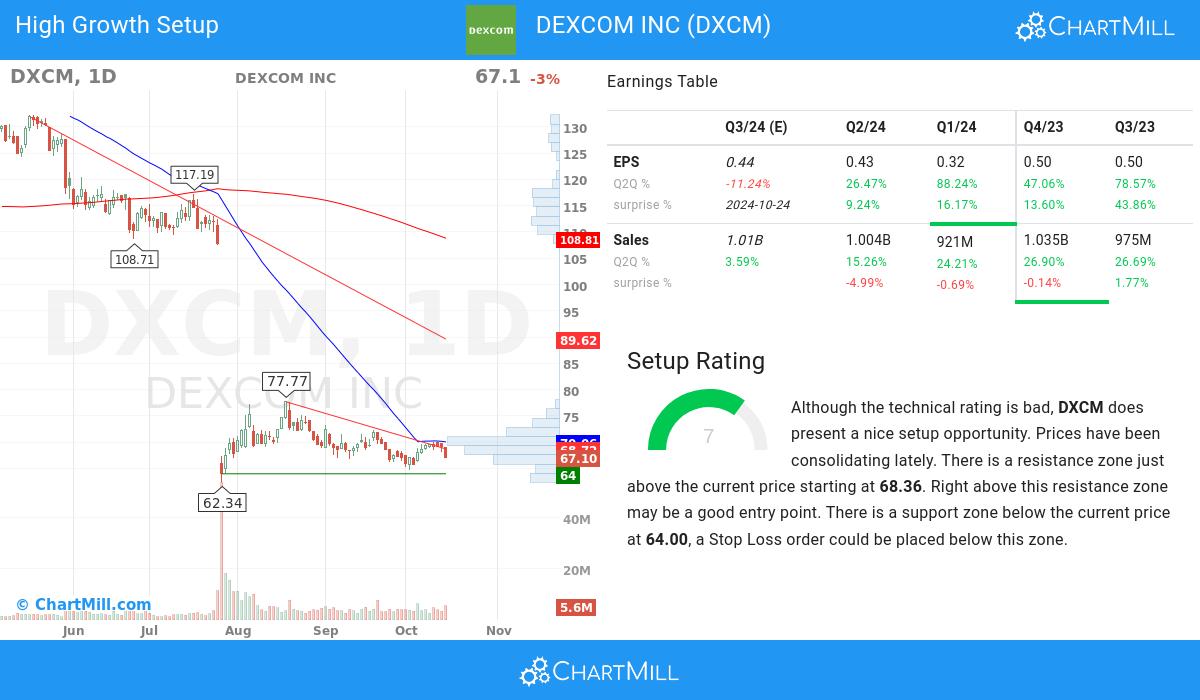
ChartMill incorporates a Setup Rating in its analysis, which measures the extent of consolidation in a stock over recent days and weeks. This rating, ranging from 0 to 10, is updated daily and takes into account multiple short-term technical indicators. The current setup rating for NASDAQ:DXCM is 7:
Although the technical rating is bad, DXCM does present a nice setup opportunity. Prices have been consolidating lately. There is a resistance zone just above the current price starting at 68.36. Right above this resistance zone may be a good entry point. There is a support zone below the current price at 64.00, a Stop Loss order could be placed below this zone.
Every day, new Strong Growth stocks can be found on ChartMill in our Strong Growth screener.
For an up to date full fundamental analysis you can check the fundamental report of DXCM
For an up to date full technical analysis you can check the technical report of DXCM
Keep in mind
Important Note: The content of this article is not intended as trading advice. It is essential to perform your own analysis and exercise caution when making trading decisions. The article presents observations created by automated analysis but does not guarantee any trading or investment outcomes. Always trade responsibly and make independent judgments.
71.66
+0.88 (+1.24%)
Find more stocks in the Stock Screener
DXCM Latest News and Analysis
 17 days ago - ChartmillWhat's going on in today's session: S&P500 movers
Stay updated with the movements of the S&P500 index in the middle of the day on Thursday. Discover which stocks are leading as top gainers and losers in today's session.
