
DOUBLEVERIFY HOLDINGS INC (NYSE:DV), a strong growth stock, setting up for a breakout.
By Mill Chart
Last update: Feb 27, 2025
In this article we will dive into DOUBLEVERIFY HOLDINGS INC (NYSE:DV) as a possible candidate for growth investing. Investors should always do their own research, but we noticed DOUBLEVERIFY HOLDINGS INC showing up in our strong growth, ready to breakout screen, which makes it worth to investigate a bit more.
Analyzing Growth Metrics
ChartMill employs its own Growth Rating system for all stocks. This score, ranging from 0 to 10, is derived by evaluating different growth factors, such as EPS and revenue growth, taking into account both past performance and future projections. NYSE:DV has earned a 8 for growth:
- The Earnings Per Share has grown by an nice 15.62% over the past year.
- The Earnings Per Share has been growing by 83.14% on average over the past years. This is a very strong growth
- Looking at the last year, DV shows a quite strong growth in Revenue. The Revenue has grown by 19.58% in the last year.
- DV shows a strong growth in Revenue. Measured over the last years, the Revenue has been growing by 40.57% yearly.
- DV is expected to show a strong growth in Earnings Per Share. In the coming years, the EPS will grow by 34.16% yearly.
- DV is expected to show quite a strong growth in Revenue. In the coming years, the Revenue will grow by 14.23% yearly.
A Closer Look at Health for NYSE:DV
Every stock is evaluated by ChartMill, receiving a Health Rating on a scale of 0 to 10. This assessment considers different health aspects, including liquidity and solvency, both in absolute terms and relative to industry peers. NYSE:DV has achieved a 7 out of 10:
- An Altman-Z score of 13.44 indicates that DV is not in any danger for bankruptcy at the moment.
- DV has a better Altman-Z score (13.44) than 89.45% of its industry peers.
- The Debt to FCF ratio of DV is 0.03, which is an excellent value as it means it would take DV, only 0.03 years of fcf income to pay off all of its debts.
- DV has a better Debt to FCF ratio (0.03) than 80.00% of its industry peers.
- DV has a Debt/Equity ratio of 0.00. This is a healthy value indicating a solid balance between debt and equity.
- With a decent Debt to Equity ratio value of 0.00, DV is doing good in the industry, outperforming 66.55% of the companies in the same industry.
- DV has a Current Ratio of 6.57. This indicates that DV is financially healthy and has no problem in meeting its short term obligations.
- DV has a Current ratio of 6.57. This is amongst the best in the industry. DV outperforms 92.36% of its industry peers.
- A Quick Ratio of 6.57 indicates that DV has no problem at all paying its short term obligations.
- The Quick ratio of DV (6.57) is better than 92.36% of its industry peers.
Looking at the Profitability
ChartMill assigns a proprietary Profitability Rating to each stock. The score is computed by evaluating various profitability ratios and margins and ranges from 0 to 10. NYSE:DV was assigned a score of 8 for profitability:
- DV's Return On Assets of 5.02% is fine compared to the rest of the industry. DV outperforms 75.64% of its industry peers.
- DV's Return On Equity of 5.83% is fine compared to the rest of the industry. DV outperforms 72.73% of its industry peers.
- DV's Return On Invested Capital of 4.90% is fine compared to the rest of the industry. DV outperforms 74.91% of its industry peers.
- The 3 year average ROIC (4.10%) for DV is below the current ROIC(4.90%), indicating increased profibility in the last year.
- DV has a Profit Margin of 10.33%. This is in the better half of the industry: DV outperforms 75.64% of its industry peers.
- DV's Profit Margin has improved in the last couple of years.
- DV has a better Operating Margin (12.74%) than 81.82% of its industry peers.
- In the last couple of years the Operating Margin of DV has grown nicely.
- Looking at the Gross Margin, with a value of 82.42%, DV belongs to the top of the industry, outperforming 87.27% of the companies in the same industry.
How do we evaluate the setup for NYSE:DV?
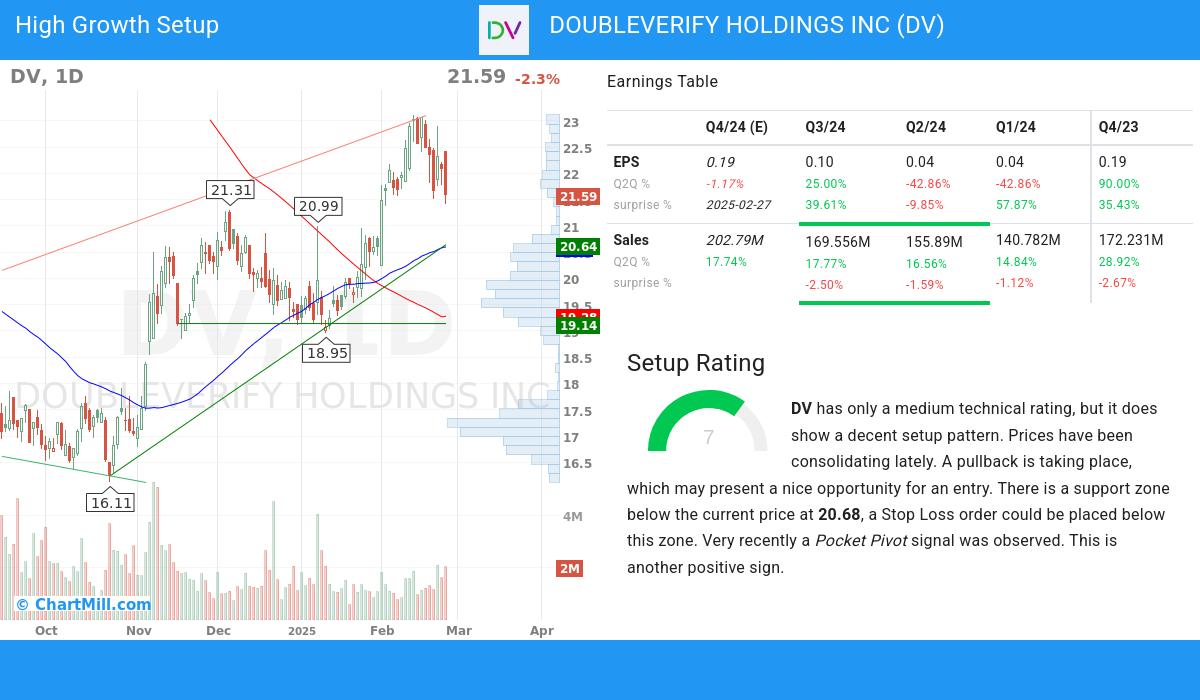
ChartMill takes into account not only the Technical Rating but also assigns a Setup Rating to each stock. This rating, on a scale of 0 to 10, reflects the degree of consolidation observed based on short-term technical indicators. Currently, NYSE:DV exhibits a 7 setup rating, indicating its consolidation status in recent days and weeks.
Although the technical rating is only medium, DV does present a nice setup opportunity. Prices have been consolidating lately. A pullback is taking place, which may present a nice opportunity for an entry. There is a support zone below the current price at 20.68, a Stop Loss order could be placed below this zone. Another positive sign is the recent Pocket Pivot signal.
More Strong Growth stocks can be found in our Strong Growth screener.
Our latest full fundamental report of DV contains the most current fundamental analsysis.
For an up to date full technical analysis you can check the technical report of DV
Keep in mind
This article should in no way be interpreted as advice. The article is based on the observed metrics at the time of writing, but you should always make your own analysis and trade or invest at your own responsibility.
