
Uncovering Noteworthy Technical Analysis Findings for DANAHER CORP (NYSE:DHR).
By Mill Chart
Last update: Oct 16, 2024
Our stock screener has identified DANAHER CORP (NYSE:DHR) as a potential breakout candidate. This technical breakout setup pattern occurs when the stock consolidates after a strong uptrend. While the actual breakout is uncertain, it may be worth keeping an eye on NYSE:DHR.
In-Depth Technical Analysis of NYSE:DHR
ChartMill employs a sophisticated system to assign a Technical Rating to every stock in its analysis. This rating, which ranges from 0 to 10, is determined by carefully assessing multiple technical indicators and properties.
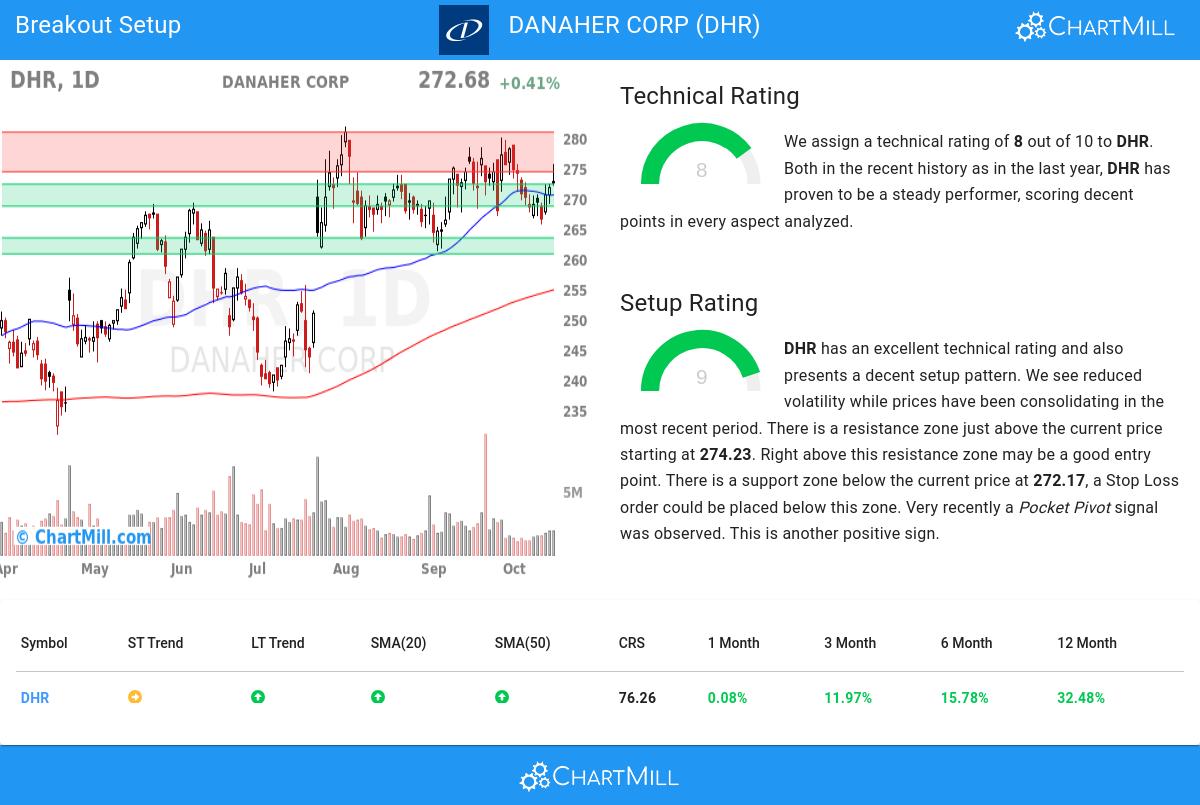
We assign a technical rating of 8 out of 10 to DHR. Both in the recent history as in the last year, DHR has proven to be a steady performer, scoring decent points in every aspect analyzed.
- The long term trend is positive and the short term trend is neutral. The long term trend gets the benefit of the doubt for now.
- Looking at the yearly performance, DHR did better than 76% of all other stocks. We also observe that the gains produced by DHR over the past year are nicely spread over this period.
- DHR is one of the better performing stocks in the Life Sciences Tools & Services industry, it outperforms 80% of 56 stocks in the same industry.
- DHR is currently trading near its 52 week high, which is a good sign. The S&P500 Index however is also trading near new highs, which makes the performance in line with the market.
- In the last month DHR has a been trading in a tight range between 265.50 and 279.90.
Check the latest full technical report of DHR for a complete technical analysis.
Looking at the Setup
Next to the Technical Rating, the Setup Rating of a stock determines to which extend the stock is consolidating. This score also ranges from 0 to 10 and is updated daily. The setup score evaluates various short term technical indicators. For NYSE:DHR this score is currently 9:
Besides having an excellent technical rating, DHR also presents a decent setup pattern. We see reduced volatility while prices have been consolidating in the most recent period. There is a resistance zone just above the current price starting at 274.23. Right above this resistance zone may be a good entry point. There is a support zone below the current price at 272.17, a Stop Loss order could be placed below this zone. Another positive sign is the recent Pocket Pivot signal.
How to trade NYSE:DHR?
For a potential trade one would typically wait until the stock breaks out of the consolidation zone to enter the stock and it could be sold again for a loss when it would fall back below the zone.
Disclaimer: This article is not intended to provide trading advice. It is crucial to conduct your own analysis and consider your own observations and trading style when making investment decisions. The article solely presents technical observations and should not be relied upon as a sole basis for trading.
Our Breakout screener lists more breakout setups and is updated daily.
Keep in mind
This article should in no way be interpreted as advice. The article is based on the observed metrics at the time of writing, but you should always make your own analysis and trade or invest at your own responsibility.
186.83
-3.83 (-2.01%)
Find more stocks in the Stock Screener
DHR Latest News and Analysis
 15 days ago - ChartmillThese S&P500 stocks are moving in today's after hours session
Discover the top S&P500 movers in Thursday's after-hours session and stay informed about the post-market dynamics.
