
NYSE:DECK is probably undervalued for the fundamentals it is displaying.
By Mill Chart
Last update: Oct 23, 2024
Uncover the hidden value in DECKERS OUTDOOR CORP (NYSE:DECK) as our stock screening tool recommends it as an undervalued choice. NYSE:DECK maintains a robust financial position and offers an attractive pricing perspective. Let's dig deeper into the analysis.
A Closer Look at Valuation for NYSE:DECK
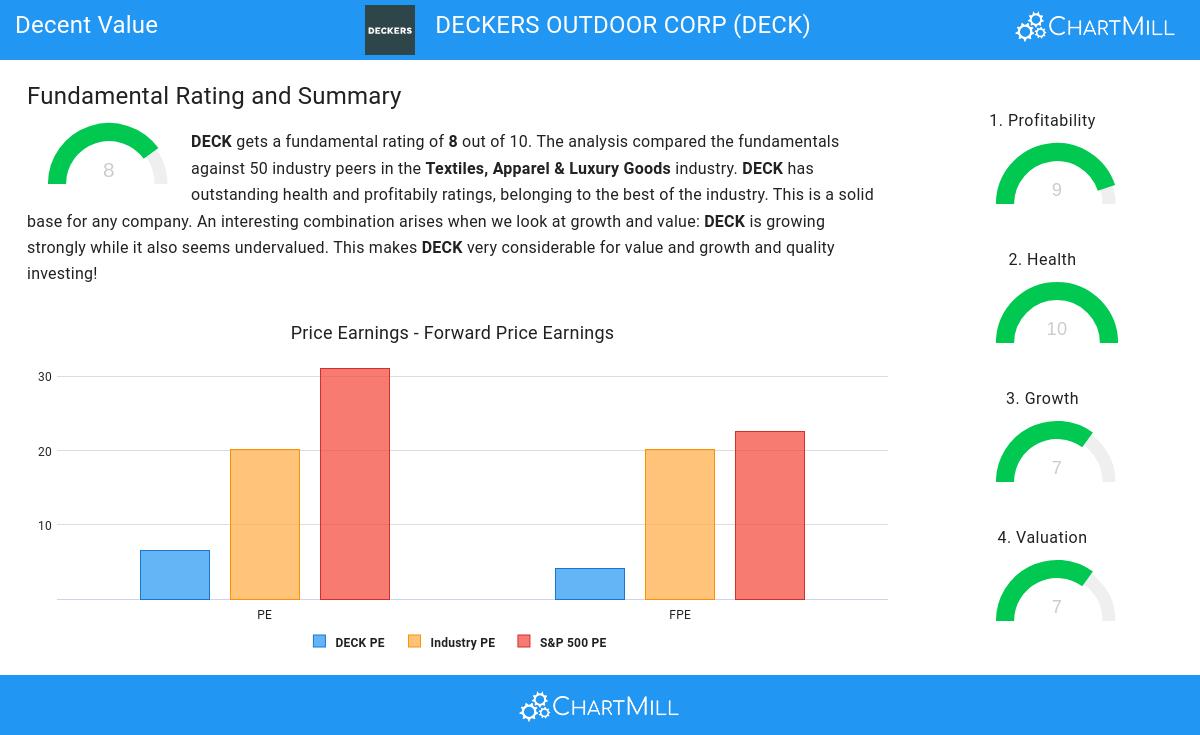
ChartMill assigns a Valuation Rating to every stock. This score ranges from 0 to 10 and evaluates the different valuation aspects and compares the price to earnings and cash flows, while taking into account profitability and growth. NYSE:DECK scores a 7 out of 10:
- The Price/Earnings ratio is 6.55, which indicates a rather cheap valuation of DECK.
- Based on the Price/Earnings ratio, DECK is valued cheaply inside the industry as 98.00% of the companies are valued more expensively.
- Compared to an average S&P500 Price/Earnings ratio of 31.10, DECK is valued rather cheaply.
- The Price/Forward Earnings ratio is 4.17, which indicates a rather cheap valuation of DECK.
- Compared to the rest of the industry, the Price/Forward Earnings ratio of DECK indicates a rather cheap valuation: DECK is cheaper than 100.00% of the companies listed in the same industry.
- Compared to an average S&P500 Price/Forward Earnings ratio of 22.54, DECK is valued rather cheaply.
- The low PEG Ratio(NY), which compensates the Price/Earnings for growth, indicates a rather cheap valuation of the company.
- The excellent profitability rating of DECK may justify a higher PE ratio.
- DECK's earnings are expected to grow with 20.20% in the coming years. This may justify a more expensive valuation.
A Closer Look at Profitability for NYSE:DECK
ChartMill assigns a proprietary Profitability Rating to each stock. The score is computed by evaluating various profitability ratios and margins and ranges from 0 to 10. NYSE:DECK was assigned a score of 9 for profitability:
- With an excellent Return On Assets value of 24.55%, DECK belongs to the best of the industry, outperforming 98.00% of the companies in the same industry.
- Looking at the Return On Equity, with a value of 39.12%, DECK belongs to the top of the industry, outperforming 94.00% of the companies in the same industry.
- DECK has a better Return On Invested Capital (32.34%) than 98.00% of its industry peers.
- Measured over the past 3 years, the Average Return On Invested Capital for DECK is significantly above the industry average of 11.90%.
- The last Return On Invested Capital (32.34%) for DECK is above the 3 year average (26.50%), which is a sign of increasing profitability.
- DECK has a better Profit Margin (18.29%) than 98.00% of its industry peers.
- DECK's Profit Margin has improved in the last couple of years.
- DECK has a Operating Margin of 22.49%. This is amongst the best in the industry. DECK outperforms 96.00% of its industry peers.
- In the last couple of years the Operating Margin of DECK has grown nicely.
- Looking at the Gross Margin, with a value of 56.54%, DECK is in the better half of the industry, outperforming 72.00% of the companies in the same industry.
- DECK's Gross Margin has improved in the last couple of years.
Assessing Health for NYSE:DECK
ChartMill assigns a Health Rating to every stock. This score ranges from 0 to 10 and evaluates the different health aspects like liquidity and solvency, both absolutely, but also relative to the industry peers. NYSE:DECK scores a 10 out of 10:
- DECK has an Altman-Z score of 15.19. This indicates that DECK is financially healthy and has little risk of bankruptcy at the moment.
- The Altman-Z score of DECK (15.19) is better than 98.00% of its industry peers.
- There is no outstanding debt for DECK. This means it has a Debt/Equity and Debt/FCF ratio of 0 and it is amongst the best of the sector and industry.
- DECK has a Current Ratio of 2.86. This indicates that DECK is financially healthy and has no problem in meeting its short term obligations.
- DECK has a Current ratio of 2.86. This is in the better half of the industry: DECK outperforms 70.00% of its industry peers.
- DECK has a Quick Ratio of 2.04. This indicates that DECK is financially healthy and has no problem in meeting its short term obligations.
- With an excellent Quick ratio value of 2.04, DECK belongs to the best of the industry, outperforming 86.00% of the companies in the same industry.
Growth Analysis for NYSE:DECK
ChartMill assigns a Growth Rating to each stock, ranging from 0 to 10. This rating is determined by analyzing different growth elements, including EPS and revenue growth, spanning both historical and future figures. In the case of NYSE:DECK, the assigned 7 reflects its growth potential:
- The Earnings Per Share has grown by an nice 16.67% over the past year.
- Measured over the past years, DECK shows a very strong growth in Earnings Per Share. The EPS has been growing by 23.27% on average per year.
- DECK shows a strong growth in Revenue. In the last year, the Revenue has grown by 20.30%.
- Measured over the past years, DECK shows a quite strong growth in Revenue. The Revenue has been growing by 16.24% on average per year.
- The Earnings Per Share is expected to grow by 18.07% on average over the next years. This is quite good.
- DECK is expected to show quite a strong growth in Revenue. In the coming years, the Revenue will grow by 10.42% yearly.
Every day, new Decent Value stocks can be found on ChartMill in our Decent Value screener.
Check the latest full fundamental report of DECK for a complete fundamental analysis.
Disclaimer
This is not investing advice! The article highlights some of the observations at the time of writing, but you should always make your own analysis and invest based on your own insights.