
Our stockscreener has identified a possible breakout setup on DELTA AIR LINES INC (NYSE:DAL). This occurs when the stock consolidates following a significant upward movement. While the breakout outcome cannot be guaranteed, it may be worth monitoring NYSE:DAL for potential opportunities.
What is the technical picture of NYSE:DAL telling us.
ChartMill utilizes a proprietary algorithm to assign a Technical Rating to every stock. This rating, ranging from 0 to 10, is computed daily by analyzing a variety of technical indicators and properties.
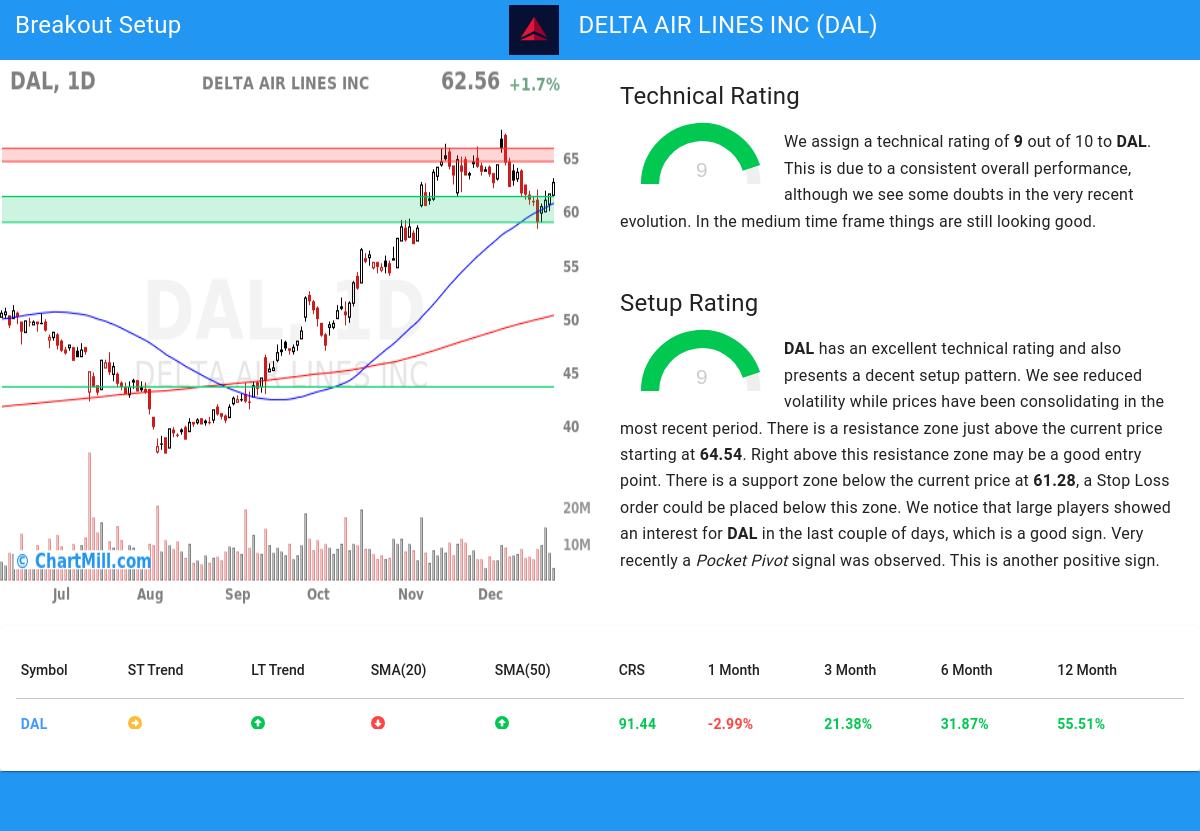
Taking everything into account, DAL scores 9 out of 10 in our technical rating. In the last year, DAL was one of the better performers, but we do observe some doubts in the very recent evolution.
- The long term trend is positive and the short term trend is neutral. The long term trend gets the benefit of the doubt for now.
- When comparing the yearly performance of all stocks, we notice that DAL is one of the better performing stocks in the market, outperforming 91% of all stocks. On top of that, DAL also shows a nice and consistent pattern of rising prices.
- DAL is currently trading in the upper part of its 52 week range. The S&P500 Index however is currently trading near a new high, so DAL is lagging the market slightly.
- DAL is part of the Passenger Airlines industry. There are 23 other stocks in this industry, DAL did better than 63% of them.
- In the last month DAL has a been trading in the 58.31 - 67.50 range, which is quite wide. It is currently trading in the middle of this range, so some resistance may be found above.
For an up to date full technical analysis you can check the technical report of DAL
Why is NYSE:DAL a setup?
Next to the Technical Rating, the Setup Rating of a stock determines to which extend the stock is consolidating. This score also ranges from 0 to 10 and is updated daily. The setup score evaluates various short term technical indicators. For NYSE:DAL this score is currently 9:
Besides having an excellent technical rating, DAL also presents a decent setup pattern. We see reduced volatility while prices have been consolidating in the most recent period. There is a resistance zone just above the current price starting at 64.54. Right above this resistance zone may be a good entry point. There is a support zone below the current price at 61.28, a Stop Loss order could be placed below this zone. We notice that large players showed an interest for DAL in the last couple of days, which is a good sign. Very recently a Pocket Pivot signal was observed. This is another positive sign.
Trading setups like NYSE:DAL
A breakout opportunity may arise when the stock surpasses the current consolidation zone and reaches new highs. Traders often wait for this breakout before considering buying the stock. To manage risk, a stop loss order could be placed below the consolidation zone to limit potential losses.
Please note that this article should not be construed as trading advice. The information provided is solely based on automated technical analysis and serves to highlight technical observations. It is important to conduct your own analysis and make trading decisions based on your own judgment and responsibility.
Our Breakout screener lists more breakout setups and is updated daily.
Disclaimer
This article should in no way be interpreted as advice. The article is based on the observed metrics at the time of writing, but you should always make your own analysis and trade or invest at your own responsibility.


