
Good technical signals and a possible breakout for CAESARS ENTERTAINMENT INC.
By Mill Chart
Last update: Oct 30, 2024
CAESARS ENTERTAINMENT INC (NASDAQ:CZR) was identified as a Technical Breakout Setup Pattern by our stockscreener. Such a pattern occurs when we see a pause in a strong uptrend: after a strong rise the stock is consolidating a bit and at some point the trend may be continued. Whether this actually happens can not be predicted of course, but it may be a good idea to keep and eye on NASDAQ:CZR.
What is the technical picture of NASDAQ:CZR telling us.
ChartMill utilizes a proprietary algorithm to assign a Technical Rating to every stock. This rating, ranging from 0 to 10, is computed daily by analyzing a variety of technical indicators and properties.
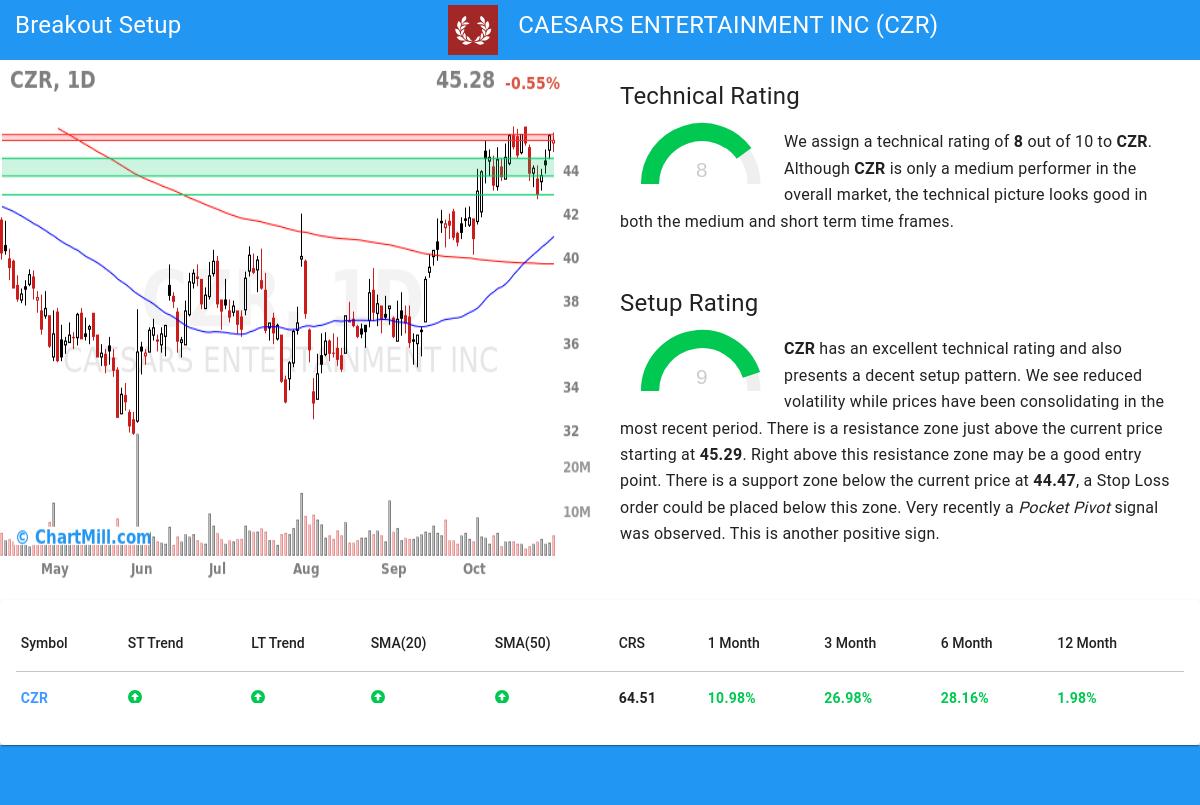
We assign a technical rating of 8 out of 10 to CZR. Although CZR is only a medium performer in the overall market, the technical picture looks good in both the medium and short term time frames.
- The long and short term trends are both positive. This is looking good!
- CZR is currently trading in the upper part of its 52 week range. The S&P500 Index however is currently trading near a new high, so CZR is lagging the market slightly.
- In the last month CZR has a been trading in the 41.40 - 45.93 range, which is quite wide. It is currently trading near the high of this range.
- When comparing the performance of all stocks over the past year, CZR turns out to be only a medium performer in the overall market: it outperformed 64% of all stocks.
- CZR is an average performer in the Hotels, Restaurants & Leisure industry, it outperforms 59% of 134 stocks in the same industry.
For an up to date full technical analysis you can check the technical report of CZR
Looking at the Setup
Alongside the Technical Rating, ChartMill assigns a Setup Rating to evaluate the consolidation level of a stock. This rating, ranging from 0 to 10, is updated daily and considers various short-term technical indicators. The current setup rating for NASDAQ:CZR is 9:
Besides having an excellent technical rating, CZR also presents a decent setup pattern. Prices have been consolidating lately and the volatility has been reduced. There is a resistance zone just above the current price starting at 45.29. Right above this resistance zone may be a good entry point. There is a support zone below the current price at 44.47, a Stop Loss order could be placed below this zone. Very recently a Pocket Pivot signal was observed. This is another positive sign.
How to trade NASDAQ:CZR?
One strategy to consider is waiting for the actual breakout to occur, where the stock breaks out above the current consolidation zone. Traders can then enter a buy position, anticipating further upward momentum. As a risk management measure, it is advisable to set a stop loss order below the consolidation zone.
This article should in no way be interpreted as trading advice. You should always make your own analysis and trade or not trade based on your own observations and style. The article is based purely on some technical observations.
Our Breakout screener lists more breakout setups and is updated daily.
Disclaimer
This is not investing advice! The article highlights some of the observations at the time of writing, but you should always make your own analysis and invest based on your own insights.
25.51
+0.76 (+3.07%)
Find more stocks in the Stock Screener
CZR Latest News and Analysis
 6 days ago - ChartmillGapping S&P500 stocks in Monday's session
Looking for opportunities in today's market? Check out the S&P500 gap up and gap down stocks on Monday and stay ahead of the market trends.
 10 days ago - ChartmillTop S&P500 movers in Wednesday's after hours session
Wondering what's happening in today's after-hours session with S&P500 stocks? Stay tuned for the latest updates on movers and shakers.
 16 days ago - ChartmillWhich S&P500 stocks have an unusual volume on Thursday?
In today's session, there are S&P500 stocks with remarkable trading volume. Explore the stocks exhibiting unusual volume in Thursday's session.
 17 days ago - ChartmillStay informed with the top movers within the S&P500 index on Wednesday.
Get insights into the S&P500 index performance on Wednesday. Explore the top gainers and losers within the S&P500 index in today's session.
17 days ago - ChartmillWednesday's session: top gainers and losers in the S&P500 indexStay updated with the movements of the S&P500 index in the middle of the day on Wednesday. Discover which stocks are leading as top gainers and losers in today's session.
 18 days ago - ChartmillTop S&P500 movers in Wednesday's pre-market session
Discover the top S&P500 movers in Wednesday's pre-market session and stay informed about market dynamics.
19 days ago - ChartmillWhat's going on in today's session: S&P500 moversStay informed about the performance of the S&P500 index one hour before the close of the markets on Monday. Uncover the top gainers and losers in today's session for valuable insights.
19 days ago - ChartmillExploring the top movers within the S&P500 index during today's session.Let's have a look at what is happening on the US markets in the middle of the day on Monday. Below you can find the top S&P500 gainers and losers in today's session.
