
In-Depth Technical Analysis of CHEVRON CORP.
By Mill Chart
Last update: Feb 25, 2025
Our stock screener has detected a potential breakout setup on CHEVRON CORP (NYSE:CVX). This breakout pattern is observed when a stock consolidates following a strong upward movement. It's important to note that this pattern is based on technical analysis, and the actual breakout outcome is uncertain. However, it might be worth keeping an eye on NYSE:CVX.
Technical Analysis Observations
Every day, ChartMill assigns a Technical Rating to each stock, providing a score ranging from 0 to 10. This rating is determined by evaluating various technical indicators and properties.
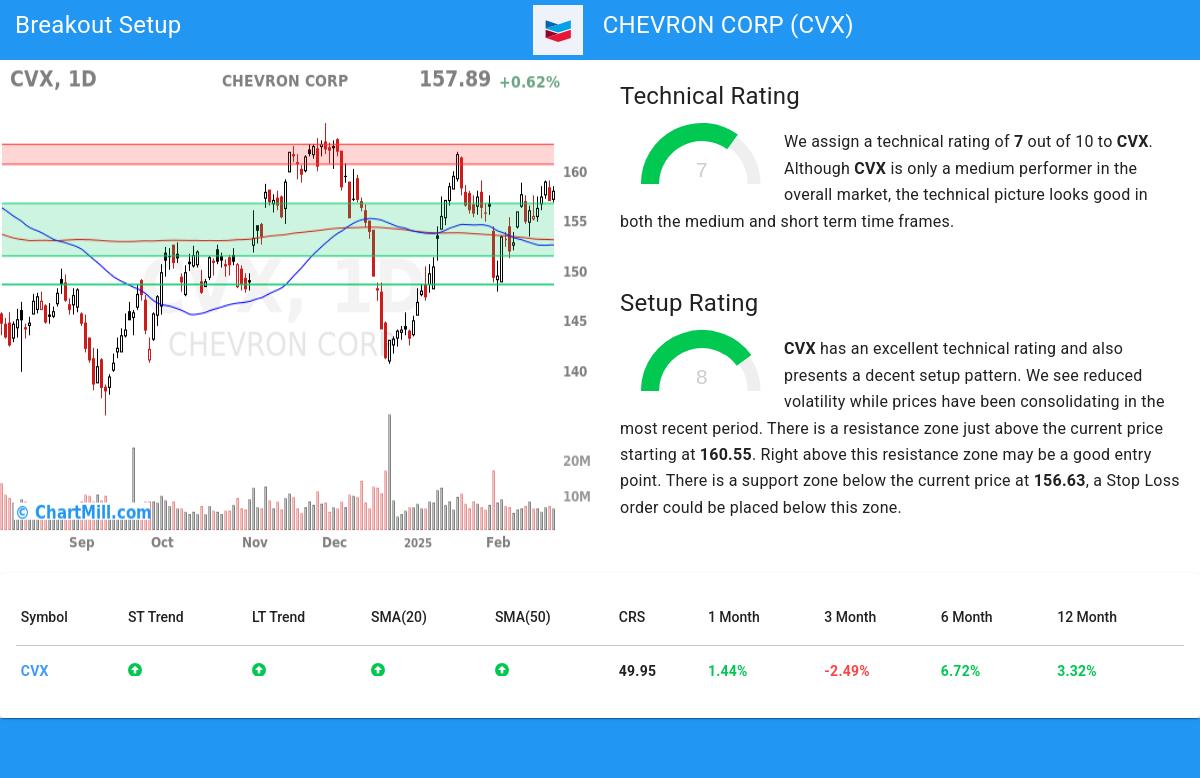
Overall CVX gets a technical rating of 7 out of 10. Although CVX is only a medium performer in the overall market, the technical picture looks good in both the medium and short term time frames.
- Both the short term and long term trends are positive. This is a very positive sign.
- In the last month CVX has a been trading in the 147.80 - 158.95 range, which is quite wide. It is currently trading near the high of this range.
- When comparing the performance of all stocks over the past year, CVX turns out to be only a medium performer in the overall market: it outperformed 49% of all stocks.
- CVX is part of the Oil, Gas & Consumable Fuels industry. There are 210 other stocks in this industry, CVX did better than 63% of them.
- CVX is currently trading in the middle of its 52 week range. The S&P500 Index however is trading in the upper part of its 52 week range, so CVX is lagging the market slightly.
Our latest full technical report of CVX contains the most current technical analsysis.
Why is NYSE:CVX a setup?
ChartMill also assign a Setup Rating to every stock. With this score it is determined to what extend the stock has been trading in a range in the recent days and weeks. This score also ranges from 0 to 10 and is updated daily. The setup score evaluates various short term technical indicators. NYSE:CVX scores a 8 out of 10:
CVX has an excellent technical rating and also presents a decent setup pattern. Prices have been consolidating lately and the volatility has been reduced. There is a resistance zone just above the current price starting at 160.55. Right above this resistance zone may be a good entry point. There is a support zone below the current price at 156.63, a Stop Loss order could be placed below this zone.
How to trade NYSE:CVX?
For a potential trade one would typically wait until the stock breaks out of the consolidation zone to enter the stock and it could be sold again for a loss when it would fall back below the zone.
Please note that this article should not be construed as trading advice. The information provided is solely based on automated technical analysis and serves to highlight technical observations. It is important to conduct your own analysis and make trading decisions based on your own judgment and responsibility.
Every day, new breakout setups can be found on ChartMill in our Breakout screener.
Disclaimer
Important Note: The content of this article is not intended as trading advice. It is essential to perform your own analysis and exercise caution when making trading decisions. The article presents observations created by automated analysis but does not guarantee any trading or investment outcomes. Always trade responsibly and make independent judgments.
139.07
+2.39 (+1.75%)
Find more stocks in the Stock Screener
CVX Latest News and Analysis
 2 days ago - ChartmillUncovering Dividend Opportunities with CHEVRON CORP (NYSE:CVX).
Uncovering Dividend Opportunities with CHEVRON CORP (NYSE:CVX).
