Analyzing NYSE:CVX's Dividend Potential.
By Mill Chart
Last update: Sep 25, 2024
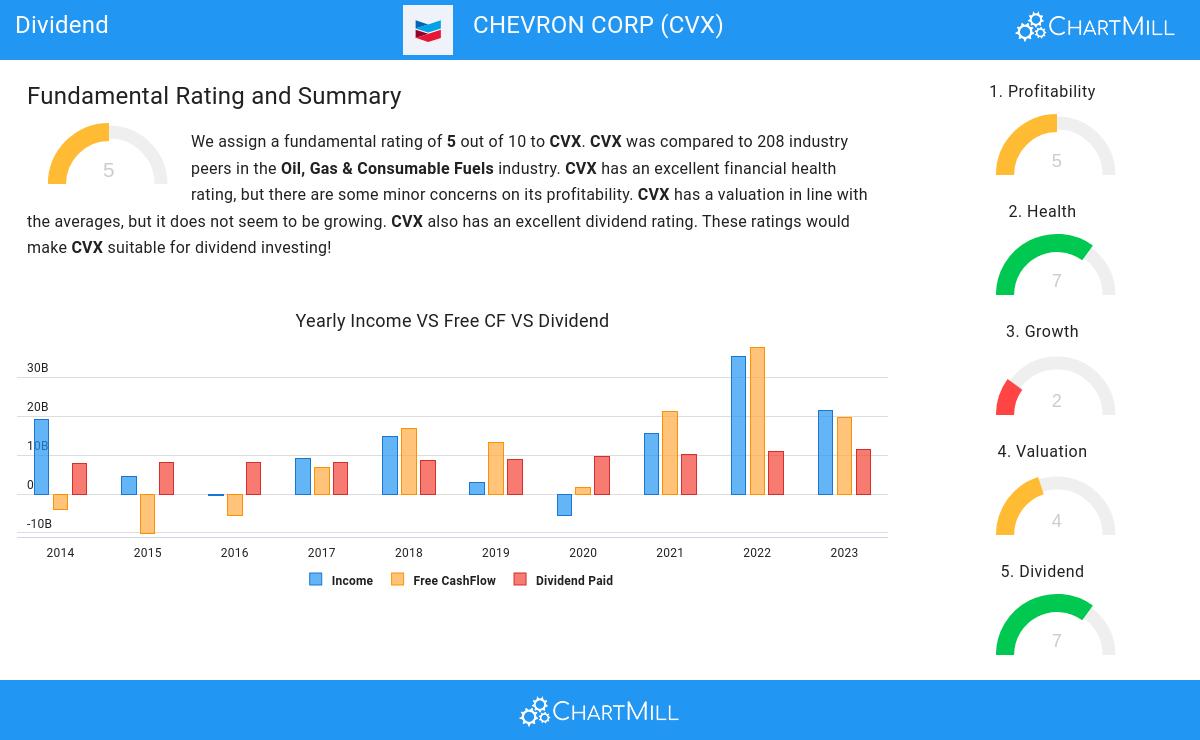
Consider CHEVRON CORP (NYSE:CVX) as a top pick for dividend investors, identified by our stock screening tool. NYSE:CVX shines in terms of profitability, solvency, and liquidity, all while paying a decent dividend. Let's dive deeper into the analysis.
Understanding NYSE:CVX's Dividend Score
ChartMill employs its own Dividend Rating system for all stocks. This score, on a scale of 0 to 10, is determined by evaluating different dividend factors, such as yield, historical performance, dividend growth, and sustainability. NYSE:CVX has been assigned a 7 for dividend:
- With a Yearly Dividend Yield of 4.50%, CVX is a good candidate for dividend investing.
- CVX's Dividend Yield is a higher than the industry average which is at 6.09.
- CVX's Dividend Yield is rather good when compared to the S&P500 average which is at 2.21.
- On average, the dividend of CVX grows each year by 6.07%, which is quite nice.
- CVX has been paying a dividend for at least 10 years, so it has a reliable track record.
- CVX has not decreased their dividend for at least 10 years, which is a reliable track record.
Evaluating Health: NYSE:CVX
ChartMill assigns a proprietary Health Rating to each stock. The score is computed by evaluating various liquidity and solvency ratios and ranges from 0 to 10. NYSE:CVX was assigned a score of 7 for health:
- CVX has an Altman-Z score of 3.76. This indicates that CVX is financially healthy and has little risk of bankruptcy at the moment.
- With an excellent Altman-Z score value of 3.76, CVX belongs to the best of the industry, outperforming 83.65% of the companies in the same industry.
- CVX has a debt to FCF ratio of 1.28. This is a very positive value and a sign of high solvency as it would only need 1.28 years to pay back of all of its debts.
- Looking at the Debt to FCF ratio, with a value of 1.28, CVX belongs to the top of the industry, outperforming 84.13% of the companies in the same industry.
- CVX has a Debt/Equity ratio of 0.13. This is a healthy value indicating a solid balance between debt and equity.
- CVX has a better Debt to Equity ratio (0.13) than 75.00% of its industry peers.
Looking at the Profitability
ChartMill utilizes a Profitability Rating to assess stocks, scoring them on a scale of 0 to 10. This rating takes into account a variety of profitability ratios and margins, both in absolute terms and in comparison to industry peers. NYSE:CVX has earned a 5 out of 10:
- CVX has a better Return On Assets (7.18%) than 62.98% of its industry peers.
- In the last couple of years the Profit Margin of CVX has grown nicely.
- In the last couple of years the Operating Margin of CVX has grown nicely.
Every day, new Best Dividend stocks can be found on ChartMill in our Best Dividend screener.
Check the latest full fundamental report of CVX for a complete fundamental analysis.
Keep in mind
Important Note: The content of this article is not intended as trading advice. It is essential to perform your own analysis and exercise caution when making trading decisions. The article presents observations created by automated analysis but does not guarantee any trading or investment outcomes. Always trade responsibly and make independent judgments.
135.36
+0.82 (+0.61%)
Find more stocks in the Stock Screener
CVX Latest News and Analysis
 15 days ago - ChartmillWhy CHEVRON CORP (NYSE:CVX) qualifies as a good dividend investing stock.
Why the dividend investor may take a look at CHEVRON CORP (NYSE:CVX).
