Is NYSE:CTRE on the Verge of a Major Breakout as a Strong Growth Stock?
By Mill Chart
Last update: Feb 19, 2025
Exploring Growth Potential: CARETRUST REIT INC (NYSE:CTRE) and Its Base Formation. Growth investors seek promising revenue and EPS growth, and CARETRUST REIT INC has come under our scrutiny for potential growth investing. While it's crucial to do your own research, we've detected CARETRUST REIT INC on our screen for growth with base formation, suggesting it merits a closer look.
Growth Analysis for NYSE:CTRE
ChartMill employs its own Growth Rating system for all stocks. This score, ranging from 0 to 10, is derived by evaluating different growth factors, such as EPS and revenue growth, taking into account both past performance and future projections. NYSE:CTRE has earned a 8 for growth:
- The Earnings Per Share has grown by an impressive 70.83% over the past year.
- The Earnings Per Share has been growing by 11.30% on average over the past years. This is quite good.
- Looking at the last year, CTRE shows a very strong growth in Revenue. The Revenue has grown by 36.05%.
- Measured over the past years, CTRE shows a quite strong growth in Revenue. The Revenue has been growing by 12.64% on average per year.
- The Earnings Per Share is expected to grow by 20.31% on average over the next years. This is a very strong growth
- Based on estimates for the next years, CTRE will show a quite strong growth in Revenue. The Revenue will grow by 15.88% on average per year.
- The EPS growth rate is accelerating: in the next years the growth will be better than in the last years.
- The Revenue growth rate is accelerating: in the next years the growth will be better than in the last years.
Health Analysis for NYSE:CTRE
A critical element of ChartMill's stock evaluation is the Health Rating, which spans from 0 to 10. This rating considers multiple health factors, including liquidity and solvency, both in absolute terms and relative to industry peers. NYSE:CTRE has received a 5 out of 10:
- An Altman-Z score of 5.60 indicates that CTRE is not in any danger for bankruptcy at the moment.
- CTRE has a better Altman-Z score (5.60) than 99.21% of its industry peers.
- A Debt/Equity ratio of 0.14 indicates that CTRE is not too dependend on debt financing.
- CTRE's Debt to Equity ratio of 0.14 is amongst the best of the industry. CTRE outperforms 98.41% of its industry peers.
- CTRE has a better Current ratio (1.94) than 74.60% of its industry peers.
- Looking at the Quick ratio, with a value of 1.94, CTRE is in the better half of the industry, outperforming 76.98% of the companies in the same industry.
Profitability Insights: NYSE:CTRE
ChartMill employs its own Profitability Rating system for stock evaluation. This score, ranging from 0 to 10, is derived from an analysis of diverse profitability metrics and margins. In the case of NYSE:CTRE, the assigned 8 is noteworthy for profitability:
- Looking at the Return On Assets, with a value of 3.63%, CTRE belongs to the top of the industry, outperforming 85.71% of the companies in the same industry.
- CTRE has a better Return On Equity (4.29%) than 66.67% of its industry peers.
- The Return On Invested Capital of CTRE (4.56%) is better than 88.10% of its industry peers.
- The Average Return On Invested Capital over the past 3 years for CTRE is above the industry average of 3.11%.
- CTRE's Profit Margin of 42.07% is amongst the best of the industry. CTRE outperforms 92.86% of its industry peers.
- In the last couple of years the Profit Margin of CTRE has grown nicely.
- With an excellent Operating Margin value of 64.83%, CTRE belongs to the best of the industry, outperforming 99.21% of the companies in the same industry.
- In the last couple of years the Operating Margin of CTRE has grown nicely.
- Looking at the Gross Margin, with a value of 98.07%, CTRE belongs to the top of the industry, outperforming 98.41% of the companies in the same industry.
How do we evaluate the setup for NYSE:CTRE?
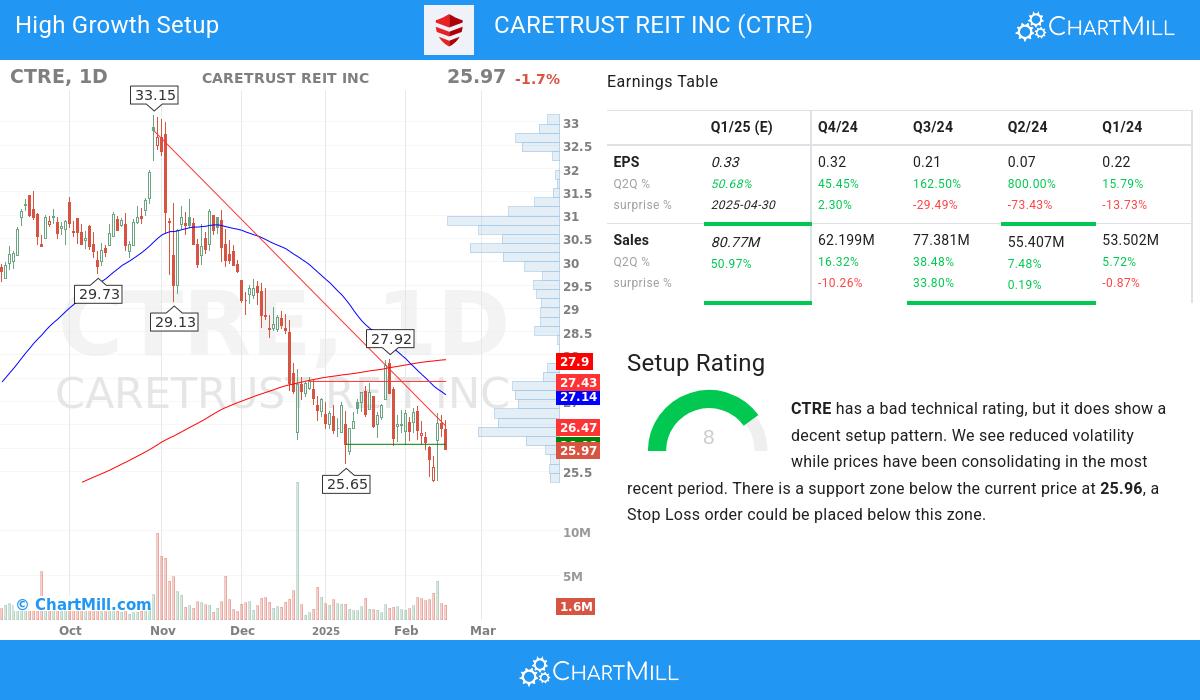
Besides the Technical Rating, ChartMill assigns a Setup Rating to every stock to determine the degree of consolidation. This rating, ranging from 0 to 10, is updated daily and evaluates various short-term technical indicators. NYSE:CTRE currently holds a 8 as its setup rating, suggesting a particular level of consolidation in the stock.
CTRE has a bad technical rating, but it does show a decent setup pattern. Prices have been consolidating lately and the volatility has been reduced. There is a support zone below the current price at 25.96, a Stop Loss order could be placed below this zone.
Every day, new Strong Growth stocks can be found on ChartMill in our Strong Growth screener.
For an up to date full fundamental analysis you can check the fundamental report of CTRE
Our latest full technical report of CTRE contains the most current technical analsysis.
Disclaimer
Important Note: The content of this article is not intended as trading advice. It is essential to perform your own analysis and exercise caution when making trading decisions. The article presents observations created by automated analysis but does not guarantee any trading or investment outcomes. Always trade responsibly and make independent judgments.
28.06
-0.69 (-2.4%)
Find more stocks in the Stock Screener
CTRE Latest News and Analysis
 6 days ago - ChartmillIs CARETRUST REIT INC (NYSE:CTRE) on the Verge of a Major Breakout as a Strong Growth Stock?
Based on fundamental and technical analysis of NYSE:CTRE we conclude: CARETRUST REIT INC (NYSE:CTRE): a strong growth stock preparing for the next leg up?.
 19 days ago - ChartmillWhy CARETRUST REIT INC (NYSE:CTRE) is Poised for High Growth.
A fundamental and technical analysis of (NYSE:CTRE): Should you consider CARETRUST REIT INC (NYSE:CTRE) for high growth investing?
