
Technical Signals Point to a Possible Breakout for CARETRUST REIT INC.
By Mill Chart
Last update: Oct 21, 2024
Our stock screener has flagged CARETRUST REIT INC (NYSE:CTRE) as a potential breakout candidate. This occurs when the stock shows signs of consolidation after a notable upward trend. While we can't predict the actual breakout, it's worth monitoring NYSE:CTRE for potential movement.
Zooming in on the technicals.
ChartMill assigns a proprietary Technical Rating to each stock. The score is computed daily by evaluating various technical indicators and properties. The score ranges from 0 to 10.
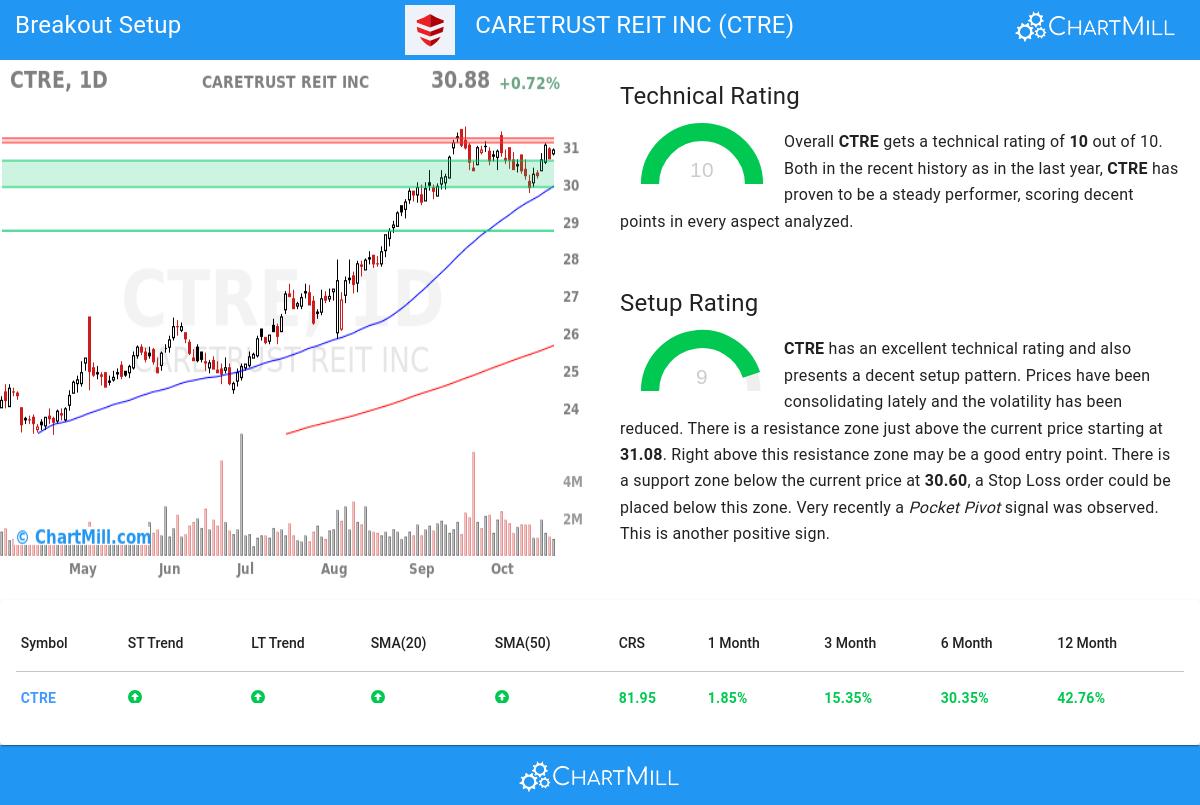
Overall CTRE gets a technical rating of 10 out of 10. This is due to a consistent performance in both the short and longer term time frames. Also compared to the overall market, CTRE is showing a nice and steady performance.
- The long and short term trends are both positive. This is looking good!
- When comparing the yearly performance of all stocks, we notice that CTRE is one of the better performing stocks in the market, outperforming 81% of all stocks. On top of that, CTRE also shows a nice and consistent pattern of rising prices.
- CTRE is part of the Diversified REITs industry. There are 129 other stocks in this industry. CTRE outperforms 75% of them.
- CTRE is currently trading near its 52 week high, which is a good sign. The S&P500 Index however is also trading near new highs, which makes the performance in line with the market.
- In the last month CTRE has a been trading in a tight range between 29.73 and 31.39.
Our latest full technical report of CTRE contains the most current technical analsysis.
How do we evaluate the setup for NYSE:CTRE?
In addition to the Technical Rating, ChartMill provides a Setup Rating for each stock. This rating, ranging from 0 to 10, assesses the level of consolidation in the stock based on multiple short-term technical indicators. Currently, NYSE:CTRE has a 9 as its setup rating, indicating its current consolidation status.
Besides having an excellent technical rating, CTRE also presents a decent setup pattern. Prices have been consolidating lately and the volatility has been reduced. There is a resistance zone just above the current price starting at 31.08. Right above this resistance zone may be a good entry point. There is a support zone below the current price at 30.60, a Stop Loss order could be placed below this zone. Another positive sign is the recent Pocket Pivot signal.
How to trade NYSE:CTRE?
For a potential trade one would typically wait until the stock breaks out of the consolidation zone to enter the stock and it could be sold again for a loss when it would fall back below the zone.
Please note that this article should not be construed as trading advice. The information provided is solely based on automated technical analysis and serves to highlight technical observations. It is important to conduct your own analysis and make trading decisions based on your own judgment and responsibility.
More breakout setups can be found in our Breakout screener.
Disclaimer
This is not investing advice! The article highlights some of the observations at the time of writing, but you should always make your own analysis and invest based on your own insights.