
When you look at COTERRA ENERGY INC (NYSE:CTRA), it's hard to ignore the strong fundamentals, especially considering its likely undervaluation.
By Mill Chart
Last update: Mar 8, 2025
Our stock screening tool has identified COTERRA ENERGY INC (NYSE:CTRA) as an undervalued gem with strong fundamentals. NYSE:CTRA boasts decent financial health and profitability while maintaining an attractive price point. We'll break it down further.
Valuation Assessment of NYSE:CTRA
ChartMill employs its own Valuation Rating system for all stocks. This score, ranging from 0 to 10, is determined by evaluating different valuation factors, including price to earnings and free cash flow, both in absolute terms and relative to the market and industry. NYSE:CTRA has earned a 7 for valuation:
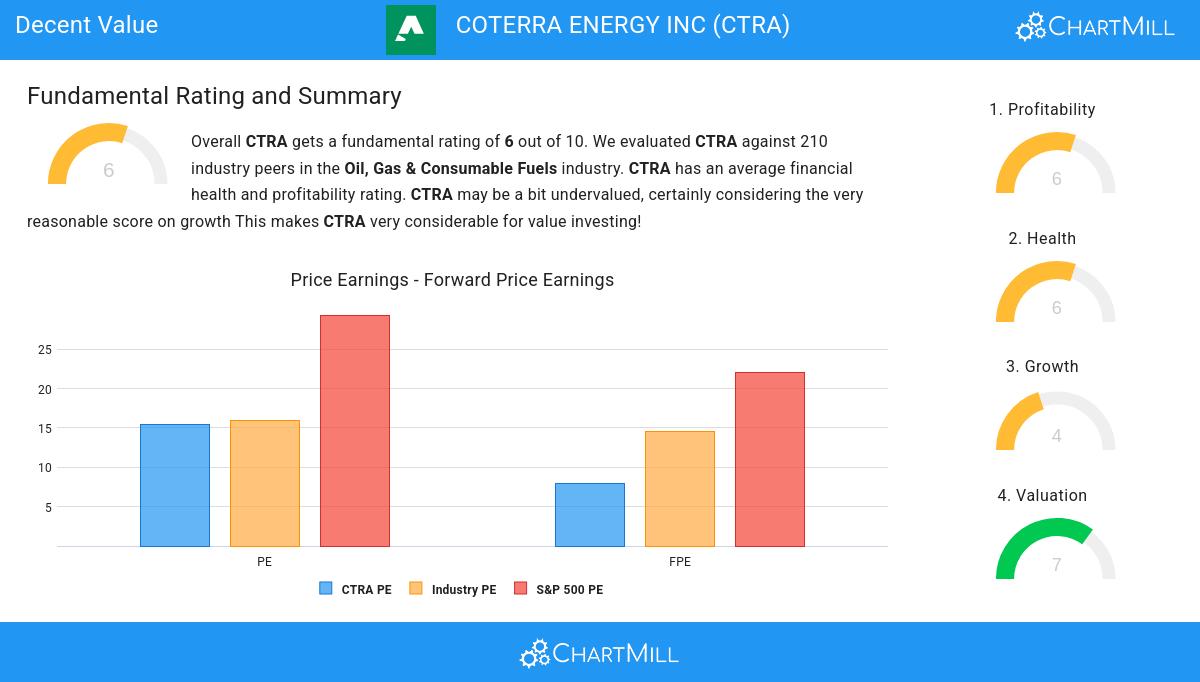
- When comparing the Price/Earnings ratio of CTRA to the average of the S&P500 Index (29.35), we can say CTRA is valued slightly cheaper.
- Based on the Price/Forward Earnings ratio of 7.97, the valuation of CTRA can be described as very cheap.
- Based on the Price/Forward Earnings ratio, CTRA is valued a bit cheaper than the industry average as 72.86% of the companies are valued more expensively.
- CTRA's Price/Forward Earnings ratio indicates a rather cheap valuation when compared to the S&P500 average which is at 22.10.
- Based on the Enterprise Value to EBITDA ratio, CTRA is valued a bit cheaper than 62.86% of the companies in the same industry.
- CTRA's low PEG Ratio(NY), which compensates the Price/Earnings for growth, indicates a rather cheap valuation of the company.
- The decent profitability rating of CTRA may justify a higher PE ratio.
- CTRA's earnings are expected to grow with 30.53% in the coming years. This may justify a more expensive valuation.
Evaluating Profitability: NYSE:CTRA
ChartMill's Profitability Rating offers a unique perspective on stock analysis, providing scores from 0 to 10. These ratings consider a wide range of profitability metrics and margins, both in comparison to industry peers and on their own merits. For NYSE:CTRA, the assigned 6 is a significant indicator of profitability:
- CTRA has a Return On Assets of 6.15%. This is in the better half of the industry: CTRA outperforms 60.95% of its industry peers.
- The 3 year average ROIC (12.47%) for CTRA is well above the current ROIC(6.67%). The reason for the recent decline needs to be investigated.
- The Profit Margin of CTRA (21.86%) is better than 72.86% of its industry peers.
- Looking at the Operating Margin, with a value of 28.96%, CTRA is in the better half of the industry, outperforming 63.81% of the companies in the same industry.
- With an excellent Gross Margin value of 81.02%, CTRA belongs to the best of the industry, outperforming 91.43% of the companies in the same industry.
- CTRA's Gross Margin has improved in the last couple of years.
Health Examination for NYSE:CTRA
ChartMill assigns a proprietary Health Rating to each stock. The score is computed by evaluating various liquidity and solvency ratios and ranges from 0 to 10. NYSE:CTRA was assigned a score of 6 for health:
- The Altman-Z score of CTRA (2.58) is better than 75.71% of its industry peers.
- CTRA has a debt to FCF ratio of 1.85. This is a very positive value and a sign of high solvency as it would only need 1.85 years to pay back of all of its debts.
- The Debt to FCF ratio of CTRA (1.85) is better than 81.43% of its industry peers.
- CTRA has a Debt/Equity ratio of 0.16. This is a healthy value indicating a solid balance between debt and equity.
- Looking at the Debt to Equity ratio, with a value of 0.16, CTRA is in the better half of the industry, outperforming 72.86% of the companies in the same industry.
- CTRA has a Current ratio of 1.61. This is in the better half of the industry: CTRA outperforms 66.67% of its industry peers.
- CTRA's Quick ratio of 1.56 is fine compared to the rest of the industry. CTRA outperforms 69.05% of its industry peers.
What does the Growth looks like for NYSE:CTRA
To evaluate a stock's growth potential, ChartMill utilizes a Growth Rating on a scale of 0 to 10. This comprehensive assessment considers various growth aspects, including historical and estimated EPS and revenue growth. NYSE:CTRA has achieved a 4 out of 10:
- CTRA is expected to show a strong growth in Earnings Per Share. In the coming years, the EPS will grow by 28.92% yearly.
- CTRA is expected to show quite a strong growth in Revenue. In the coming years, the Revenue will grow by 14.66% yearly.
- The EPS growth rate is accelerating: in the next years the growth will be better than in the last years.
More Decent Value stocks can be found in our Decent Value screener.
For an up to date full fundamental analysis you can check the fundamental report of CTRA
Disclaimer
This article should in no way be interpreted as advice. The article is based on the observed metrics at the time of writing, but you should always make your own analysis and trade or invest at your own responsibility.
25.37
-0.09 (-0.35%)
Find more stocks in the Stock Screener
CTRA Latest News and Analysis
 10 days ago - ChartmillTop S&P500 movers in Thursday's pre-market session
Let's have a look at what is happening on the US markets before the opening bell on Thursday. Below you can find the top S&P500 gainers and losers in today's pre-market session.
 18 days ago - ChartmillThese S&P500 stocks are gapping in today's session
Let's have a look at the S&P500 gap up and gap down stocks in today's session.
