
Based on good technical signals, COTERRA ENERGY INC is potentially setting up for a breakout.
By Mill Chart
Last update: Feb 24, 2025
Our stock screener has identified COTERRA ENERGY INC (NYSE:CTRA) as a potential breakout candidate. This technical breakout setup pattern occurs when the stock consolidates after a strong uptrend. While the actual breakout is uncertain, it may be worth keeping an eye on NYSE:CTRA.
In-Depth Technical Analysis of NYSE:CTRA
ChartMill employs a sophisticated system to assign a Technical Rating to every stock in its analysis. This rating, which ranges from 0 to 10, is determined by carefully assessing multiple technical indicators and properties.
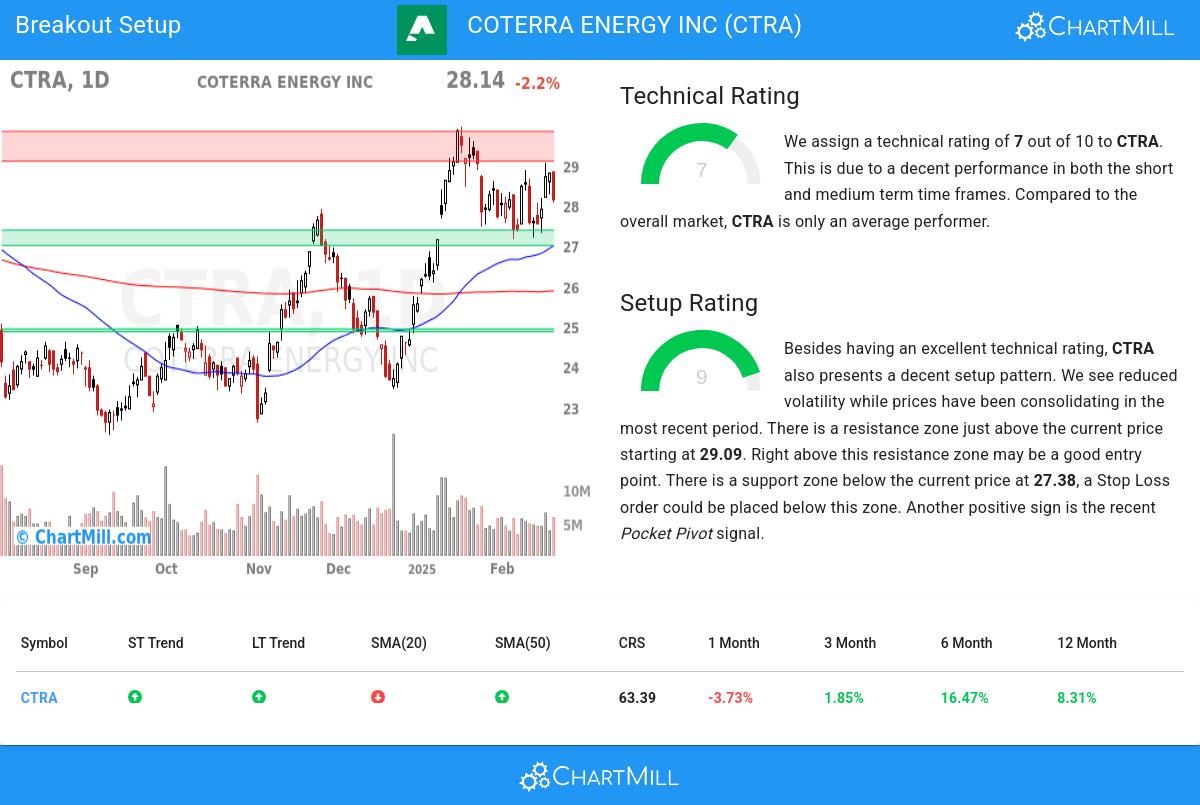
We assign a technical rating of 7 out of 10 to CTRA. This is due to a decent performance in both the short and medium term time frames. Compared to the overall market, CTRA is only an average performer.
- Both the short term and long term trends are positive. This is a very positive sign.
- CTRA is currently trading in the upper part of its 52 week range. The S&P500 Index however is currently trading near a new high, so CTRA is lagging the market slightly.
- In the last month CTRA has a been trading in the 27.15 - 29.34 range, which is quite wide. It is currently trading in the middle of this range where prices have been consolidating recently, this may present a good entry opportunity, but some resistance may be present above.
- When comparing the performance of all stocks over the past year, CTRA turns out to be only a medium performer in the overall market: it outperformed 63% of all stocks.
- CTRA is an average performer in the Oil, Gas & Consumable Fuels industry, it outperforms 69% of 210 stocks in the same industry.
Our latest full technical report of CTRA contains the most current technical analsysis.
How do we evaluate the setup for NYSE:CTRA?
In addition to the Technical Rating, ChartMill provides a Setup Rating for each stock. This rating, ranging from 0 to 10, assesses the level of consolidation in the stock based on multiple short-term technical indicators. Currently, NYSE:CTRA has a 9 as its setup rating, indicating its current consolidation status.
Besides having an excellent technical rating, CTRA also presents a decent setup pattern. We see reduced volatility while prices have been consolidating in the most recent period. There is a resistance zone just above the current price starting at 29.09. Right above this resistance zone may be a good entry point. There is a support zone below the current price at 27.38, a Stop Loss order could be placed below this zone. Very recently a Pocket Pivot signal was observed. This is another positive sign.
Trading setups like NYSE:CTRA
For a potential trade one would typically wait until the stock breaks out of the consolidation zone to enter the stock and it could be sold again for a loss when it would fall back below the zone.
Disclaimer: This article is not intended to provide trading advice. It is crucial to conduct your own analysis and consider your own observations and trading style when making investment decisions. The article solely presents technical observations and should not be relied upon as a sole basis for trading.
Our Breakout screener lists more breakout setups and is updated daily.
Keep in mind
This is not investing advice! The article highlights some of the observations at the time of writing, but you should always make your own analysis and invest based on your own insights.
25.63
+0.31 (+1.22%)
Find more stocks in the Stock Screener
CTRA Latest News and Analysis
 7 days ago - ChartmillThese S&P500 stocks are gapping in today's session
Let's have a look at the S&P500 gap up and gap down stocks in today's session.
 15 days ago - ChartmillThese S&P500 stocks are moving in today's pre-market session
Before the US market kicks off on Tuesday, let's examine the pre-market session and unveil the notable performers among the S&P500 top gainers and losers.
