
NASDAQ:CROX, an undervalued stock with good fundamentals.
By Mill Chart
Last update: Feb 25, 2025
Our stock screening tool has pinpointed CROCS INC (NASDAQ:CROX) as an undervalued stock. NASDAQ:CROX maintains a solid financial footing. Furthermore, it remains attractively priced. Let's delve into the specifics below.
Understanding NASDAQ:CROX's Valuation
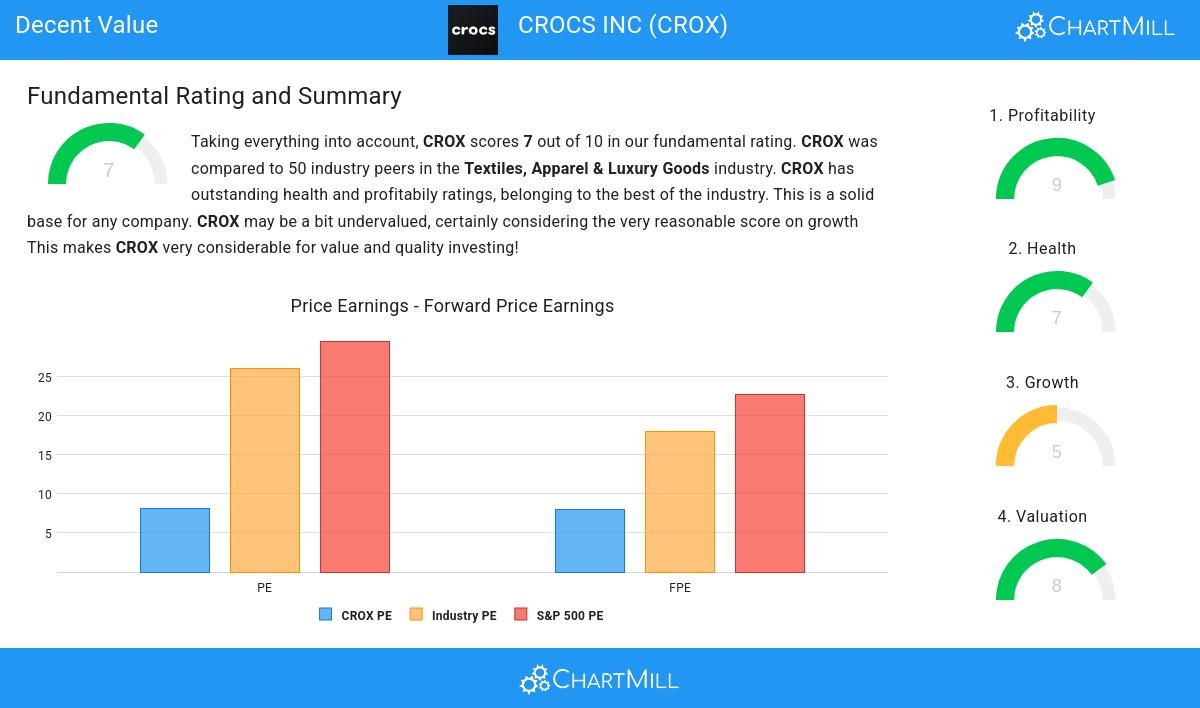
ChartMill assigns a Valuation Rating to each stock, ranging from 0 to 10. This rating is calculated by analyzing different valuation elements, such as price to earnings and free cash flow, both in absolute terms and relative to the market and industry. In the case of NASDAQ:CROX, the assigned 8 reflects its valuation:
- With a Price/Earnings ratio of 8.07, the valuation of CROX can be described as very reasonable.
- Compared to the rest of the industry, the Price/Earnings ratio of CROX indicates a rather cheap valuation: CROX is cheaper than 91.84% of the companies listed in the same industry.
- The average S&P500 Price/Earnings ratio is at 29.53. CROX is valued rather cheaply when compared to this.
- CROX is valuated reasonably with a Price/Forward Earnings ratio of 8.01.
- 91.84% of the companies in the same industry are more expensive than CROX, based on the Price/Forward Earnings ratio.
- When comparing the Price/Forward Earnings ratio of CROX to the average of the S&P500 Index (22.65), we can say CROX is valued rather cheaply.
- Based on the Enterprise Value to EBITDA ratio, CROX is valued cheaper than 81.63% of the companies in the same industry.
- Based on the Price/Free Cash Flow ratio, CROX is valued cheaper than 85.71% of the companies in the same industry.
- The excellent profitability rating of CROX may justify a higher PE ratio.
How do we evaluate the Profitability for NASDAQ:CROX?
ChartMill's Profitability Rating offers a unique perspective on stock analysis, providing scores from 0 to 10. These ratings consider a wide range of profitability metrics and margins, both in comparison to industry peers and on their own merits. For NASDAQ:CROX, the assigned 9 is a significant indicator of profitability:
- With an excellent Return On Assets value of 19.74%, CROX belongs to the best of the industry, outperforming 93.88% of the companies in the same industry.
- Looking at the Return On Equity, with a value of 51.75%, CROX belongs to the top of the industry, outperforming 95.92% of the companies in the same industry.
- CROX has a better Return On Invested Capital (23.23%) than 91.84% of its industry peers.
- CROX had an Average Return On Invested Capital over the past 3 years of 22.59%. This is significantly above the industry average of 11.63%.
- The last Return On Invested Capital (23.23%) for CROX is above the 3 year average (22.59%), which is a sign of increasing profitability.
- CROX has a better Profit Margin (23.16%) than 100.00% of its industry peers.
- CROX's Profit Margin has improved in the last couple of years.
- CROX's Operating Margin of 25.50% is amongst the best of the industry. CROX outperforms 100.00% of its industry peers.
- In the last couple of years the Operating Margin of CROX has grown nicely.
- CROX has a Gross Margin of 58.76%. This is in the better half of the industry: CROX outperforms 71.43% of its industry peers.
- CROX's Gross Margin has improved in the last couple of years.
Health Examination for NASDAQ:CROX
ChartMill employs its own Health Rating for stock assessment. This rating, ranging from 0 to 10, is calculated by examining various liquidity and solvency ratios. In the case of NASDAQ:CROX, the assigned 7 reflects its health status:
- CROX has an Altman-Z score of 3.89. This indicates that CROX is financially healthy and has little risk of bankruptcy at the moment.
- CROX has a Altman-Z score of 3.89. This is in the better half of the industry: CROX outperforms 77.55% of its industry peers.
- CROX has a debt to FCF ratio of 1.46. This is a very positive value and a sign of high solvency as it would only need 1.46 years to pay back of all of its debts.
- The Debt to FCF ratio of CROX (1.46) is better than 79.59% of its industry peers.
- Although CROX does not score too well on debt/equity it has very limited outstanding debt, which is well covered by the FCF. We will not put too much weight on the debt/equity number as it may be because of low equity, which could be a consequence of a share buyback program for instance. This needs to be investigated.
- CROX does not score too well on the current and quick ratio evaluation. However, as it has excellent solvency and profitability, these ratios do not necessarly indicate liquidity issues and need to be evaluated against the specifics of the business.
Assessing Growth Metrics for NASDAQ:CROX
ChartMill assigns a Growth Rating to each stock, ranging from 0 to 10. This rating is determined by analyzing different growth elements, including EPS and revenue growth, spanning both historical and future figures. In the case of NASDAQ:CROX, the assigned 5 reflects its growth potential:
- The Earnings Per Share has grown by an nice 9.31% over the past year.
- The Earnings Per Share has been growing by 51.64% on average over the past years. This is a very strong growth
- Measured over the past years, CROX shows a very strong growth in Revenue. The Revenue has been growing by 27.23% on average per year.
More Decent Value stocks can be found in our Decent Value screener.
Check the latest full fundamental report of CROX for a complete fundamental analysis.
Keep in mind
Important Note: The content of this article is not intended as trading advice. It is essential to perform your own analysis and exercise caution when making trading decisions. The article presents observations created by automated analysis but does not guarantee any trading or investment outcomes. Always trade responsibly and make independent judgments.
NASDAQ:CROX (12/18/2025, 1:09:25 PM)
89.54
-0.21 (-0.23%)
Find more stocks in the Stock Screener
