
NASDAQ:CROX is probably undervalued for the fundamentals it is displaying.
By Mill Chart
Last update: Jan 31, 2025
CROCS INC (NASDAQ:CROX) is a hidden gem identified by our stock screening tool, featuring undervaluation and robust fundamentals. NASDAQ:CROX showcases decent financial health and profitability, coupled with an attractive price. Let's dig deeper into the analysis.
Valuation Analysis for NASDAQ:CROX
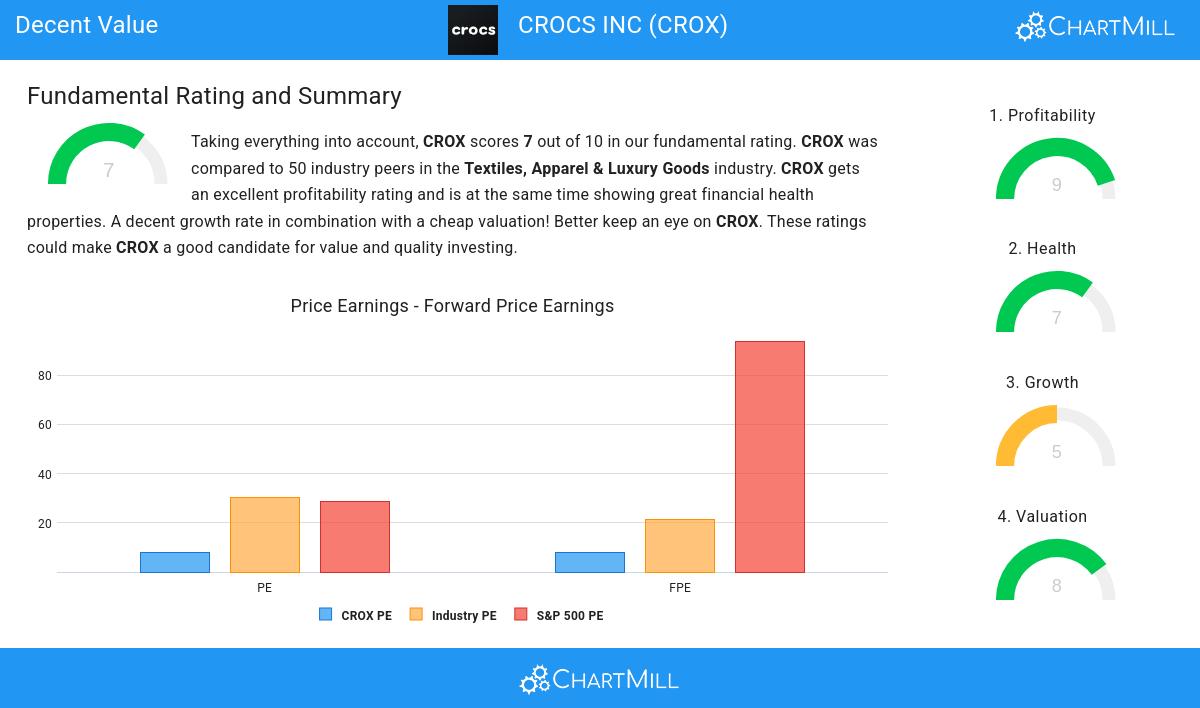
An integral part of ChartMill's stock analysis is the Valuation Rating, which spans from 0 to 10. This rating evaluates diverse valuation factors, including price to earnings and cash flows, while considering the stock's profitability and growth. NASDAQ:CROX has received a 8 out of 10:
- Based on the Price/Earnings ratio of 8.10, the valuation of CROX can be described as reasonable.
- Based on the Price/Earnings ratio, CROX is valued cheaply inside the industry as 97.96% of the companies are valued more expensively.
- The average S&P500 Price/Earnings ratio is at 28.51. CROX is valued rather cheaply when compared to this.
- The Price/Forward Earnings ratio is 8.09, which indicates a very decent valuation of CROX.
- Based on the Price/Forward Earnings ratio, CROX is valued cheaply inside the industry as 91.84% of the companies are valued more expensively.
- When comparing the Price/Forward Earnings ratio of CROX to the average of the S&P500 Index (93.88), we can say CROX is valued rather cheaply.
- Compared to the rest of the industry, the Enterprise Value to EBITDA ratio of CROX indicates a rather cheap valuation: CROX is cheaper than 89.80% of the companies listed in the same industry.
- CROX's Price/Free Cash Flow ratio is rather cheap when compared to the industry. CROX is cheaper than 87.76% of the companies in the same industry.
- CROX's low PEG Ratio(NY), which compensates the Price/Earnings for growth, indicates a rather cheap valuation of the company.
- CROX has an outstanding profitability rating, which may justify a higher PE ratio.
A Closer Look at Profitability for NASDAQ:CROX
ChartMill assigns a Profitability Rating to every stock. This score ranges from 0 to 10 and evaluates the different profitability ratios and margins, both absolutely, but also relative to the industry peers. NASDAQ:CROX scores a 9 out of 10:
- CROX's Return On Assets of 17.71% is amongst the best of the industry. CROX outperforms 93.88% of its industry peers.
- With an excellent Return On Equity value of 48.39%, CROX belongs to the best of the industry, outperforming 97.96% of the companies in the same industry.
- With an excellent Return On Invested Capital value of 21.93%, CROX belongs to the best of the industry, outperforming 89.80% of the companies in the same industry.
- Measured over the past 3 years, the Average Return On Invested Capital for CROX is significantly above the industry average of 11.39%.
- The 3 year average ROIC (30.08%) for CROX is well above the current ROIC(21.93%). The reason for the recent decline needs to be investigated.
- The Profit Margin of CROX (20.50%) is better than 100.00% of its industry peers.
- Looking at the Operating Margin, with a value of 26.15%, CROX belongs to the top of the industry, outperforming 100.00% of the companies in the same industry.
- CROX's Operating Margin has improved in the last couple of years.
- CROX has a better Gross Margin (58.15%) than 71.43% of its industry peers.
- In the last couple of years the Gross Margin of CROX has grown nicely.
Health Examination for NASDAQ:CROX
ChartMill employs a unique Health Rating system for all stocks. This rating, ranging from 0 to 10, is determined by analyzing various liquidity and solvency ratios. For NASDAQ:CROX, the assigned 7 for health provides valuable insights:
- CROX has an Altman-Z score of 3.89. This indicates that CROX is financially healthy and has little risk of bankruptcy at the moment.
- With a decent Altman-Z score value of 3.89, CROX is doing good in the industry, outperforming 73.47% of the companies in the same industry.
- The Debt to FCF ratio of CROX is 1.51, which is an excellent value as it means it would take CROX, only 1.51 years of fcf income to pay off all of its debts.
- With a decent Debt to FCF ratio value of 1.51, CROX is doing good in the industry, outperforming 79.59% of the companies in the same industry.
- Even though the debt/equity ratio score it not favorable for CROX, it has very limited outstanding debt, so we won't put too much weight on the DE evaluation.
- CROX does not score too well on the current and quick ratio evaluation. However, as it has excellent solvency and profitability, these ratios do not necessarly indicate liquidity issues and need to be evaluated against the specifics of the business.
ChartMill's Evaluation of Growth
To evaluate a stock's growth potential, ChartMill utilizes a Growth Rating on a scale of 0 to 10. This comprehensive assessment considers various growth aspects, including historical and estimated EPS and revenue growth. NASDAQ:CROX has achieved a 5 out of 10:
- The Earnings Per Share has grown by an nice 9.17% over the past year.
- The Earnings Per Share has been growing by 55.01% on average over the past years. This is a very strong growth
- Measured over the past years, CROX shows a very strong growth in Revenue. The Revenue has been growing by 29.49% on average per year.
Every day, new Decent Value stocks can be found on ChartMill in our Decent Value screener.
For an up to date full fundamental analysis you can check the fundamental report of CROX
Disclaimer
This is not investing advice! The article highlights some of the observations at the time of writing, but you should always make your own analysis and invest based on your own insights.