
Why the dividend investor may take a look at NYSE:CRI.
By Mill Chart
Last update: Sep 27, 2024
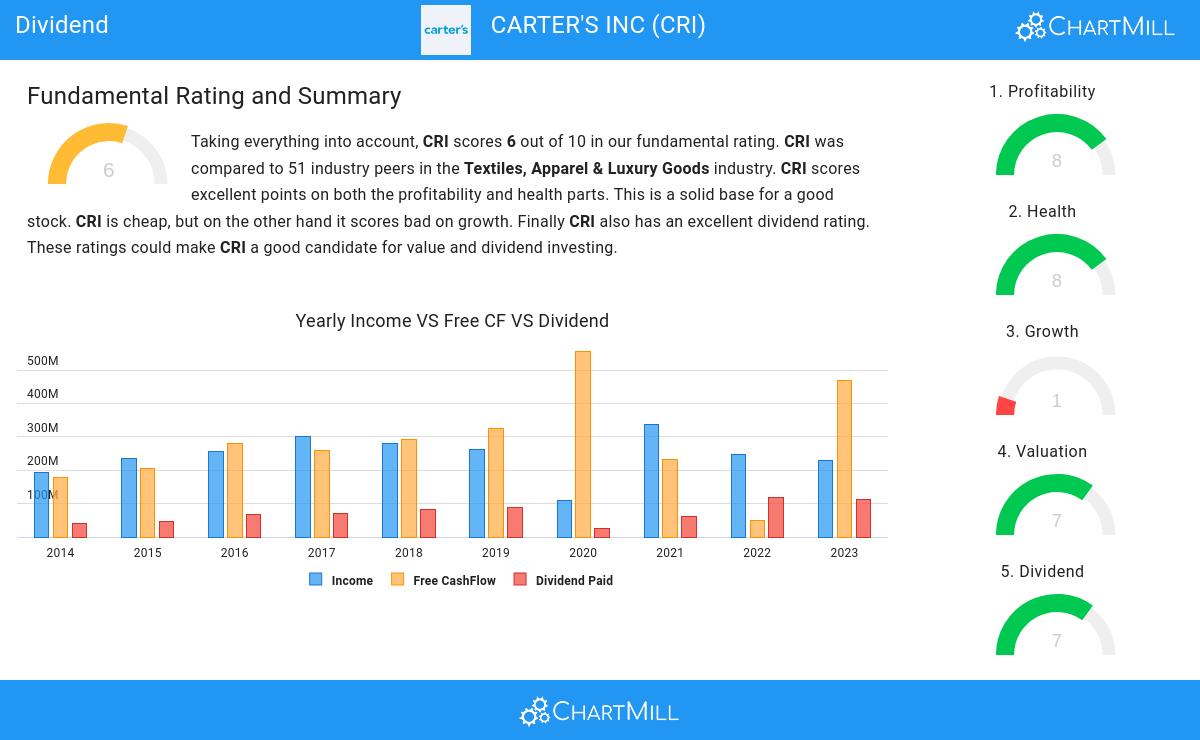
Consider CARTER'S INC (NYSE:CRI) as a top pick for dividend investors, identified by our stock screening tool. NYSE:CRI shines in terms of profitability, solvency, and liquidity, all while paying a decent dividend. Let's dive deeper into the analysis.
Assessing Dividend for NYSE:CRI
ChartMill assigns a Dividend Rating to each stock, ranging from 0 to 10. This rating is calculated by analyzing various dividend elements, such as yield, historical performance, dividend growth, and sustainability. NYSE:CRI has been awarded a 7 for its dividend quality:
- CRI has a Yearly Dividend Yield of 4.71%, which is a nice return.
- Compared to an average industry Dividend Yield of 2.88, CRI pays a better dividend. On top of this CRI pays more dividend than 94.00% of the companies listed in the same industry.
- CRI's Dividend Yield is rather good when compared to the S&P500 average which is at 2.21.
- The dividend of CRI is nicely growing with an annual growth rate of 27.93%!
- CRI has paid a dividend for at least 10 years, which is a reliable track record.
Evaluating Health: NYSE:CRI
Every stock is evaluated by ChartMill, receiving a Health Rating on a scale of 0 to 10. This assessment considers different health aspects, including liquidity and solvency, both in absolute terms and relative to industry peers. NYSE:CRI has achieved a 8 out of 10:
- An Altman-Z score of 3.41 indicates that CRI is not in any danger for bankruptcy at the moment.
- CRI has a Altman-Z score of 3.41. This is in the better half of the industry: CRI outperforms 68.00% of its industry peers.
- CRI has a debt to FCF ratio of 1.41. This is a very positive value and a sign of high solvency as it would only need 1.41 years to pay back of all of its debts.
- The Debt to FCF ratio of CRI (1.41) is better than 74.00% of its industry peers.
- Even though the debt/equity ratio score it not favorable for CRI, it has very limited outstanding debt, so we won't put too much weight on the DE evaluation.
- A Current Ratio of 2.09 indicates that CRI has no problem at all paying its short term obligations.
- CRI does not score too well on the current and quick ratio evaluation. However, as it has excellent solvency and profitability, these ratios do not necessarly indicate liquidity issues and need to be evaluated against the specifics of the business.
Profitability Analysis for NYSE:CRI
ChartMill assigns a Profitability Rating to every stock. This score ranges from 0 to 10 and evaluates the different profitability ratios and margins, both absolutely, but also relative to the industry peers. NYSE:CRI scores a 8 out of 10:
- The Return On Assets of CRI (9.93%) is better than 82.00% of its industry peers.
- CRI has a better Return On Equity (28.80%) than 86.00% of its industry peers.
- The Return On Invested Capital of CRI (13.81%) is better than 82.00% of its industry peers.
- CRI had an Average Return On Invested Capital over the past 3 years of 14.99%. This is above the industry average of 11.89%.
- Looking at the Profit Margin, with a value of 8.13%, CRI is in the better half of the industry, outperforming 78.00% of the companies in the same industry.
- Looking at the Operating Margin, with a value of 11.27%, CRI belongs to the top of the industry, outperforming 82.00% of the companies in the same industry.
- In the last couple of years the Gross Margin of CRI has grown nicely.
Every day, new Best Dividend stocks can be found on ChartMill in our Best Dividend screener.
For an up to date full fundamental analysis you can check the fundamental report of CRI
Disclaimer
This is not investing advice! The article highlights some of the observations at the time of writing, but you should always make your own analysis and invest based on your own insights.