
Consider CARTER'S INC (NYSE:CRI) as a top pick for dividend investors, identified by our stock screening tool. NYSE:CRI shines in terms of profitability, solvency, and liquidity, all while paying a decent dividend. Let's dive deeper into the analysis.
ChartMill's Evaluation of Dividend
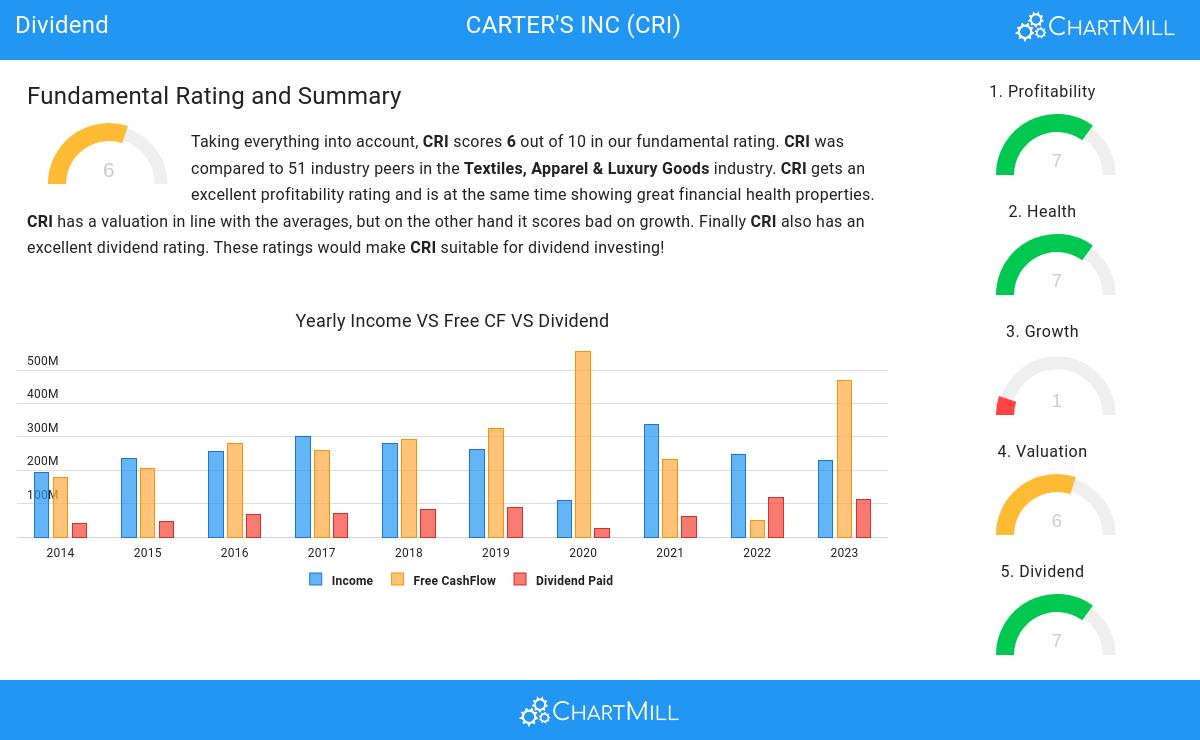
ChartMill provides a Dividend Rating for every stock, ranging from 0 to 10. This rating assesses various dividend aspects, including yield, growth, and sustainability. NYSE:CRI earns a 7 out of 10:
- CRI has a Yearly Dividend Yield of 4.85%, which is a nice return.
- CRI's Dividend Yield is rather good when compared to the industry average which is at 2.87. CRI pays more dividend than 94.00% of the companies in the same industry.
- CRI's Dividend Yield is rather good when compared to the S&P500 average which is at 2.24.
- The dividend of CRI is nicely growing with an annual growth rate of 27.93%!
- CRI has paid a dividend for at least 10 years, which is a reliable track record.
Deciphering NYSE:CRI's Health Rating
To gauge a stock's financial health, ChartMill utilizes a Health Rating on a scale of 0 to 10. This comprehensive evaluation encompasses liquidity and solvency, both in absolute terms and in comparison to industry peers. NYSE:CRI has earned a 7 out of 10:
- CRI has an Altman-Z score of 3.42. This indicates that CRI is financially healthy and has little risk of bankruptcy at the moment.
- The Altman-Z score of CRI (3.42) is better than 62.00% of its industry peers.
- The Debt to FCF ratio of CRI is 1.41, which is an excellent value as it means it would take CRI, only 1.41 years of fcf income to pay off all of its debts.
- CRI's Debt to FCF ratio of 1.41 is fine compared to the rest of the industry. CRI outperforms 74.00% of its industry peers.
- Even though the debt/equity ratio score it not favorable for CRI, it has very limited outstanding debt, so we won't put too much weight on the DE evaluation.
- A Current Ratio of 2.09 indicates that CRI has no problem at all paying its short term obligations.
Profitability Analysis for NYSE:CRI
ChartMill employs its own Profitability Rating system for stock evaluation. This score, ranging from 0 to 10, is derived from an analysis of diverse profitability metrics and margins. In the case of NYSE:CRI, the assigned 7 is noteworthy for profitability:
- CRI's Return On Assets of 9.93% is fine compared to the rest of the industry. CRI outperforms 80.00% of its industry peers.
- Looking at the Return On Equity, with a value of 28.80%, CRI belongs to the top of the industry, outperforming 84.00% of the companies in the same industry.
- CRI has a better Return On Invested Capital (13.81%) than 80.00% of its industry peers.
- The Average Return On Invested Capital over the past 3 years for CRI is above the industry average of 12.10%.
- With a decent Profit Margin value of 8.13%, CRI is doing good in the industry, outperforming 78.00% of the companies in the same industry.
- Looking at the Operating Margin, with a value of 11.27%, CRI belongs to the top of the industry, outperforming 82.00% of the companies in the same industry.
- In the last couple of years the Gross Margin of CRI has grown nicely.
Every day, new Best Dividend stocks can be found on ChartMill in our Best Dividend screener.
Our latest full fundamental report of CRI contains the most current fundamental analsysis.
Disclaimer
Important Note: The content of this article is not intended as trading advice. It is essential to perform your own analysis and exercise caution when making trading decisions. The article presents observations created by automated analysis but does not guarantee any trading or investment outcomes. Always trade responsibly and make independent judgments.