Looking for growth without the hefty price tag? Consider NASDAQ:CORT.
By Mill Chart
Last update: Jan 31, 2025
Uncover the potential of CORCEPT THERAPEUTICS INC (NASDAQ:CORT), a growth stock that our stock screener found to be reasonably priced. NASDAQ:CORT is excelling in growth aspects, maintaining a healthy financial position, and still offers an attractive valuation. We'll examine each aspect in detail.
Assessing Growth for NASDAQ:CORT
To evaluate a stock's growth potential, ChartMill utilizes a Growth Rating on a scale of 0 to 10. This comprehensive assessment considers various growth aspects, including historical and estimated EPS and revenue growth. NASDAQ:CORT has achieved a 9 out of 10:
- CORT shows a strong growth in Earnings Per Share. In the last year, the EPS has been growing by 55.56%, which is quite impressive.
- CORT shows a strong growth in Revenue. In the last year, the Revenue has grown by 39.65%.
- CORT shows quite a strong growth in Revenue. Measured over the last years, the Revenue has been growing by 13.94% yearly.
- Based on estimates for the next years, CORT will show a very strong growth in Earnings Per Share. The EPS will grow by 49.09% on average per year.
- The Revenue is expected to grow by 28.39% on average over the next years. This is a very strong growth
- The EPS growth rate is accelerating: in the next years the growth will be better than in the last years.
- The Revenue growth rate is accelerating: in the next years the growth will be better than in the last years.
Unpacking NASDAQ:CORT's Valuation Rating
To assess a stock's valuation, ChartMill utilizes a Valuation Rating on a scale of 0 to 10. This comprehensive assessment considers various valuation aspects, comparing price to earnings and cash flows, while factoring in profitability and growth. NASDAQ:CORT has achieved a 6 out of 10:
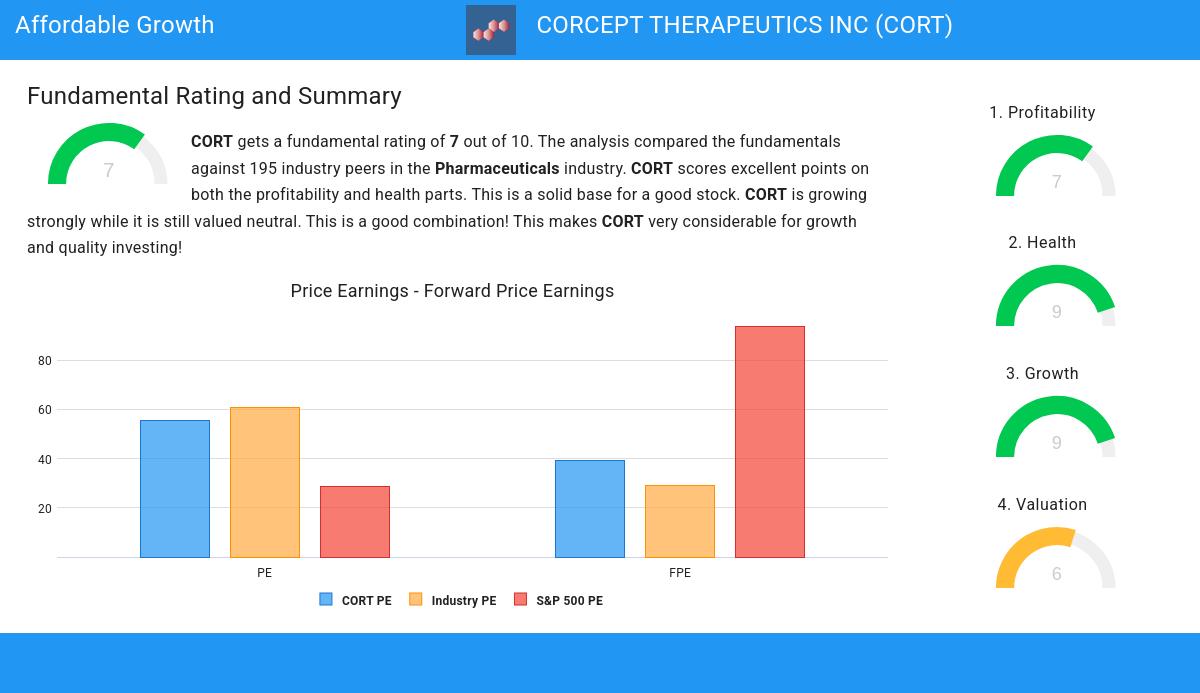
- Compared to the rest of the industry, the Price/Earnings ratio of CORT indicates a rather cheap valuation: CORT is cheaper than 80.11% of the companies listed in the same industry.
- Based on the Price/Forward Earnings ratio, CORT is valued a bit cheaper than 77.42% of the companies in the same industry.
- The average S&P500 Price/Forward Earnings ratio is at 93.88. CORT is valued rather cheaply when compared to this.
- Based on the Enterprise Value to EBITDA ratio, CORT is valued a bit cheaper than 76.88% of the companies in the same industry.
- CORT's Price/Free Cash Flow ratio is a bit cheaper when compared to the industry. CORT is cheaper than 79.57% of the companies in the same industry.
- CORT has a very decent profitability rating, which may justify a higher PE ratio.
- CORT's earnings are expected to grow with 58.77% in the coming years. This may justify a more expensive valuation.
Unpacking NASDAQ:CORT's Health Rating
A critical element of ChartMill's stock evaluation is the Health Rating, which spans from 0 to 10. This rating considers multiple health factors, including liquidity and solvency, both in absolute terms and relative to industry peers. NASDAQ:CORT has received a 9 out of 10:
- CORT has an Altman-Z score of 33.06. This indicates that CORT is financially healthy and has little risk of bankruptcy at the moment.
- The Altman-Z score of CORT (33.06) is better than 95.16% of its industry peers.
- There is no outstanding debt for CORT. This means it has a Debt/Equity and Debt/FCF ratio of 0 and it is amongst the best of the sector and industry.
- A Current Ratio of 3.70 indicates that CORT has no problem at all paying its short term obligations.
- A Quick Ratio of 3.64 indicates that CORT has no problem at all paying its short term obligations.
Profitability Insights: NASDAQ:CORT
ChartMill's Profitability Rating offers a unique perspective on stock analysis, providing scores from 0 to 10. These ratings consider a wide range of profitability metrics and margins, both in comparison to industry peers and on their own merits. For NASDAQ:CORT, the assigned 7 is a significant indicator of profitability:
- CORT has a better Return On Assets (18.08%) than 97.85% of its industry peers.
- CORT has a Return On Equity of 22.20%. This is amongst the best in the industry. CORT outperforms 94.62% of its industry peers.
- The Return On Invested Capital of CORT (18.79%) is better than 94.62% of its industry peers.
- CORT has a better Profit Margin (22.56%) than 94.62% of its industry peers.
- The Operating Margin of CORT (22.81%) is better than 89.25% of its industry peers.
- With an excellent Gross Margin value of 98.44%, CORT belongs to the best of the industry, outperforming 98.39% of the companies in the same industry.
Our Affordable Growth screener lists more Affordable Growth stocks and is updated daily.
Check the latest full fundamental report of CORT for a complete fundamental analysis.
Disclaimer
This is not investing advice! The article highlights some of the observations at the time of writing, but you should always make your own analysis and invest based on your own insights.
71.79
+2.52 (+3.64%)
Find more stocks in the Stock Screener
CORT Latest News and Analysis
 10 days ago - ChartmillInvestors seeking growth at a reasonable cost should explore CORCEPT THERAPEUTICS INC (NASDAQ:CORT).
NASDAQ:CORT is scoring great on several growth aspects while it also shows decent health and profitability. At the same time it remains remains attractively priced.
