
Investors seeking growth at a reasonable cost should explore NASDAQ:CORT.
By Mill Chart
Last update: Oct 8, 2024
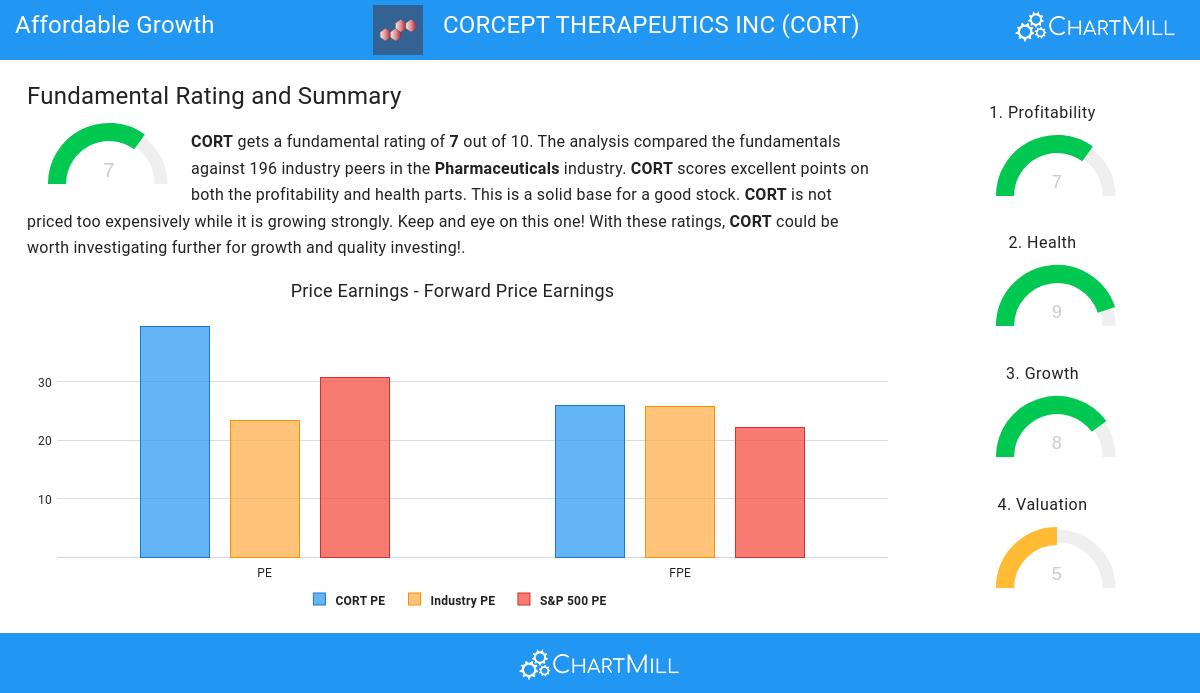
CORCEPT THERAPEUTICS INC (NASDAQ:CORT) has caught the eye of our stock screener as an affordable growth stock. NASDAQ:CORT is displaying robust growth metrics and also excels in terms of profitability, solvency, and liquidity. Additionally, it appears to be reasonably priced. Let's delve into the details.
Assessing Growth Metrics for NASDAQ:CORT
ChartMill assigns a proprietary Growth Rating to each stock. The score is computed by evaluating various growth aspects, like EPS and revenue growth. We take into account the history as well as the estimated future numbers. NASDAQ:CORT was assigned a score of 8 for growth:
- The Earnings Per Share has grown by an impressive 36.14% over the past year.
- CORT shows a strong growth in Revenue. In the last year, the Revenue has grown by 33.02%.
- The Revenue has been growing by 13.94% on average over the past years. This is quite good.
- CORT is expected to show a strong growth in Earnings Per Share. In the coming years, the EPS will grow by 26.44% yearly.
- The Revenue is expected to grow by 16.69% on average over the next years. This is quite good.
- When comparing the EPS growth rate of the last years to the growth rate of the upcoming years, we see that the growth is accelerating.
Assessing Valuation Metrics for NASDAQ:CORT
To assess a stock's valuation, ChartMill utilizes a Valuation Rating on a scale of 0 to 10. This comprehensive assessment considers various valuation aspects, comparing price to earnings and cash flows, while factoring in profitability and growth. NASDAQ:CORT has achieved a 5 out of 10:
- 80.83% of the companies in the same industry are more expensive than CORT, based on the Price/Earnings ratio.
- Based on the Price/Forward Earnings ratio, CORT is valued a bit cheaper than the industry average as 78.76% of the companies are valued more expensively.
- CORT's Enterprise Value to EBITDA ratio is a bit cheaper when compared to the industry. CORT is cheaper than 78.24% of the companies in the same industry.
- CORT's Price/Free Cash Flow ratio is rather cheap when compared to the industry. CORT is cheaper than 80.83% of the companies in the same industry.
- CORT has a very decent profitability rating, which may justify a higher PE ratio.
- CORT's earnings are expected to grow with 52.60% in the coming years. This may justify a more expensive valuation.
Assessing Health for NASDAQ:CORT
To gauge a stock's financial health, ChartMill utilizes a Health Rating on a scale of 0 to 10. This comprehensive evaluation encompasses liquidity and solvency, both in absolute terms and in comparison to industry peers. NASDAQ:CORT has earned a 9 out of 10:
- CORT has an Altman-Z score of 26.74. This indicates that CORT is financially healthy and has little risk of bankruptcy at the moment.
- CORT's Altman-Z score of 26.74 is amongst the best of the industry. CORT outperforms 90.67% of its industry peers.
- There is no outstanding debt for CORT. This means it has a Debt/Equity and Debt/FCF ratio of 0 and it is amongst the best of the sector and industry.
- A Current Ratio of 5.57 indicates that CORT has no problem at all paying its short term obligations.
- The Current ratio of CORT (5.57) is better than 66.84% of its industry peers.
- CORT has a Quick Ratio of 5.48. This indicates that CORT is financially healthy and has no problem in meeting its short term obligations.
- CORT has a Quick ratio of 5.48. This is in the better half of the industry: CORT outperforms 66.84% of its industry peers.
Profitability Examination for NASDAQ:CORT
ChartMill utilizes a Profitability Rating to assess stocks, scoring them on a scale of 0 to 10. This rating takes into account a variety of profitability ratios and margins, both in absolute terms and in comparison to industry peers. NASDAQ:CORT has earned a 7 out of 10:
- With an excellent Return On Assets value of 17.63%, CORT belongs to the best of the industry, outperforming 96.89% of the companies in the same industry.
- The Return On Equity of CORT (21.13%) is better than 92.23% of its industry peers.
- CORT has a better Return On Invested Capital (17.98%) than 94.30% of its industry peers.
- CORT has a Profit Margin of 22.12%. This is amongst the best in the industry. CORT outperforms 93.78% of its industry peers.
- CORT has a better Operating Margin (22.46%) than 89.12% of its industry peers.
- The Gross Margin of CORT (98.50%) is better than 97.93% of its industry peers.
Our Affordable Growth screener lists more Affordable Growth stocks and is updated daily.
Check the latest full fundamental report of CORT for a complete fundamental analysis.
Keep in mind
This article should in no way be interpreted as advice. The article is based on the observed metrics at the time of writing, but you should always make your own analysis and trade or invest at your own responsibility.